Within the Reporting tab, you'll discover the Facebook Ads Reporting section, providing statistical insights into your active Facebook Ads campaigns. This streamlined solution grants you access to your Facebook Ads data without requiring you to visit Facebook directly. The information is thorough, displaying campaign, ad set, and ad-level details, along with demographic insights to illuminate the audience reached by your Facebook Ads!
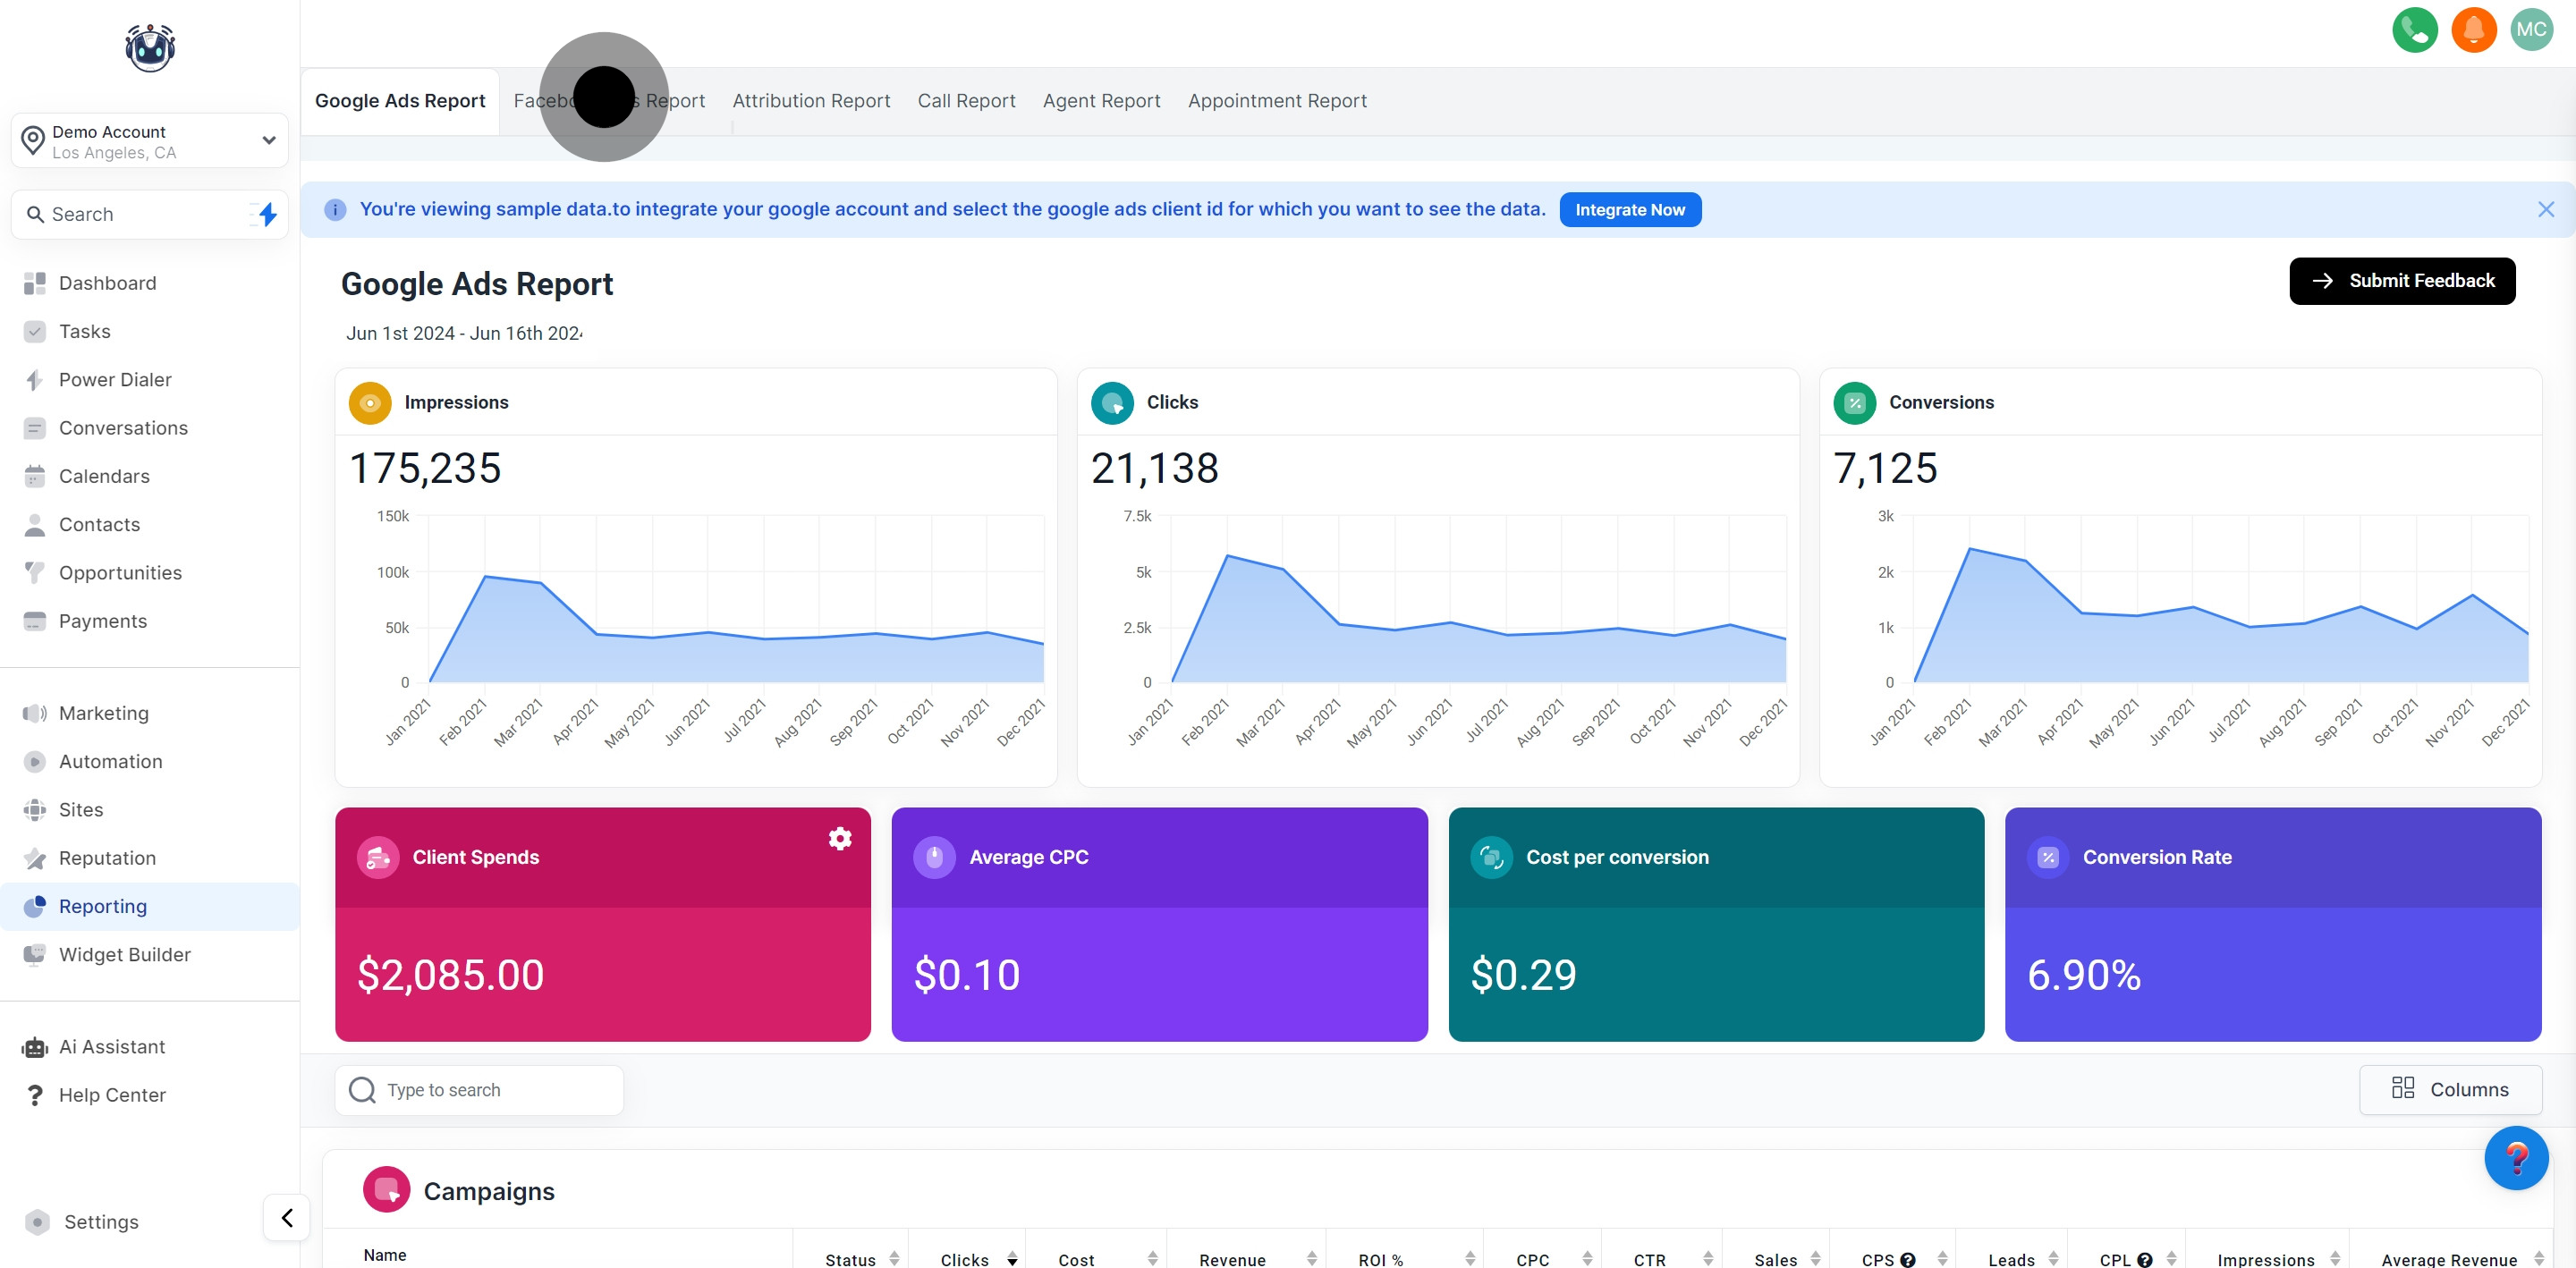
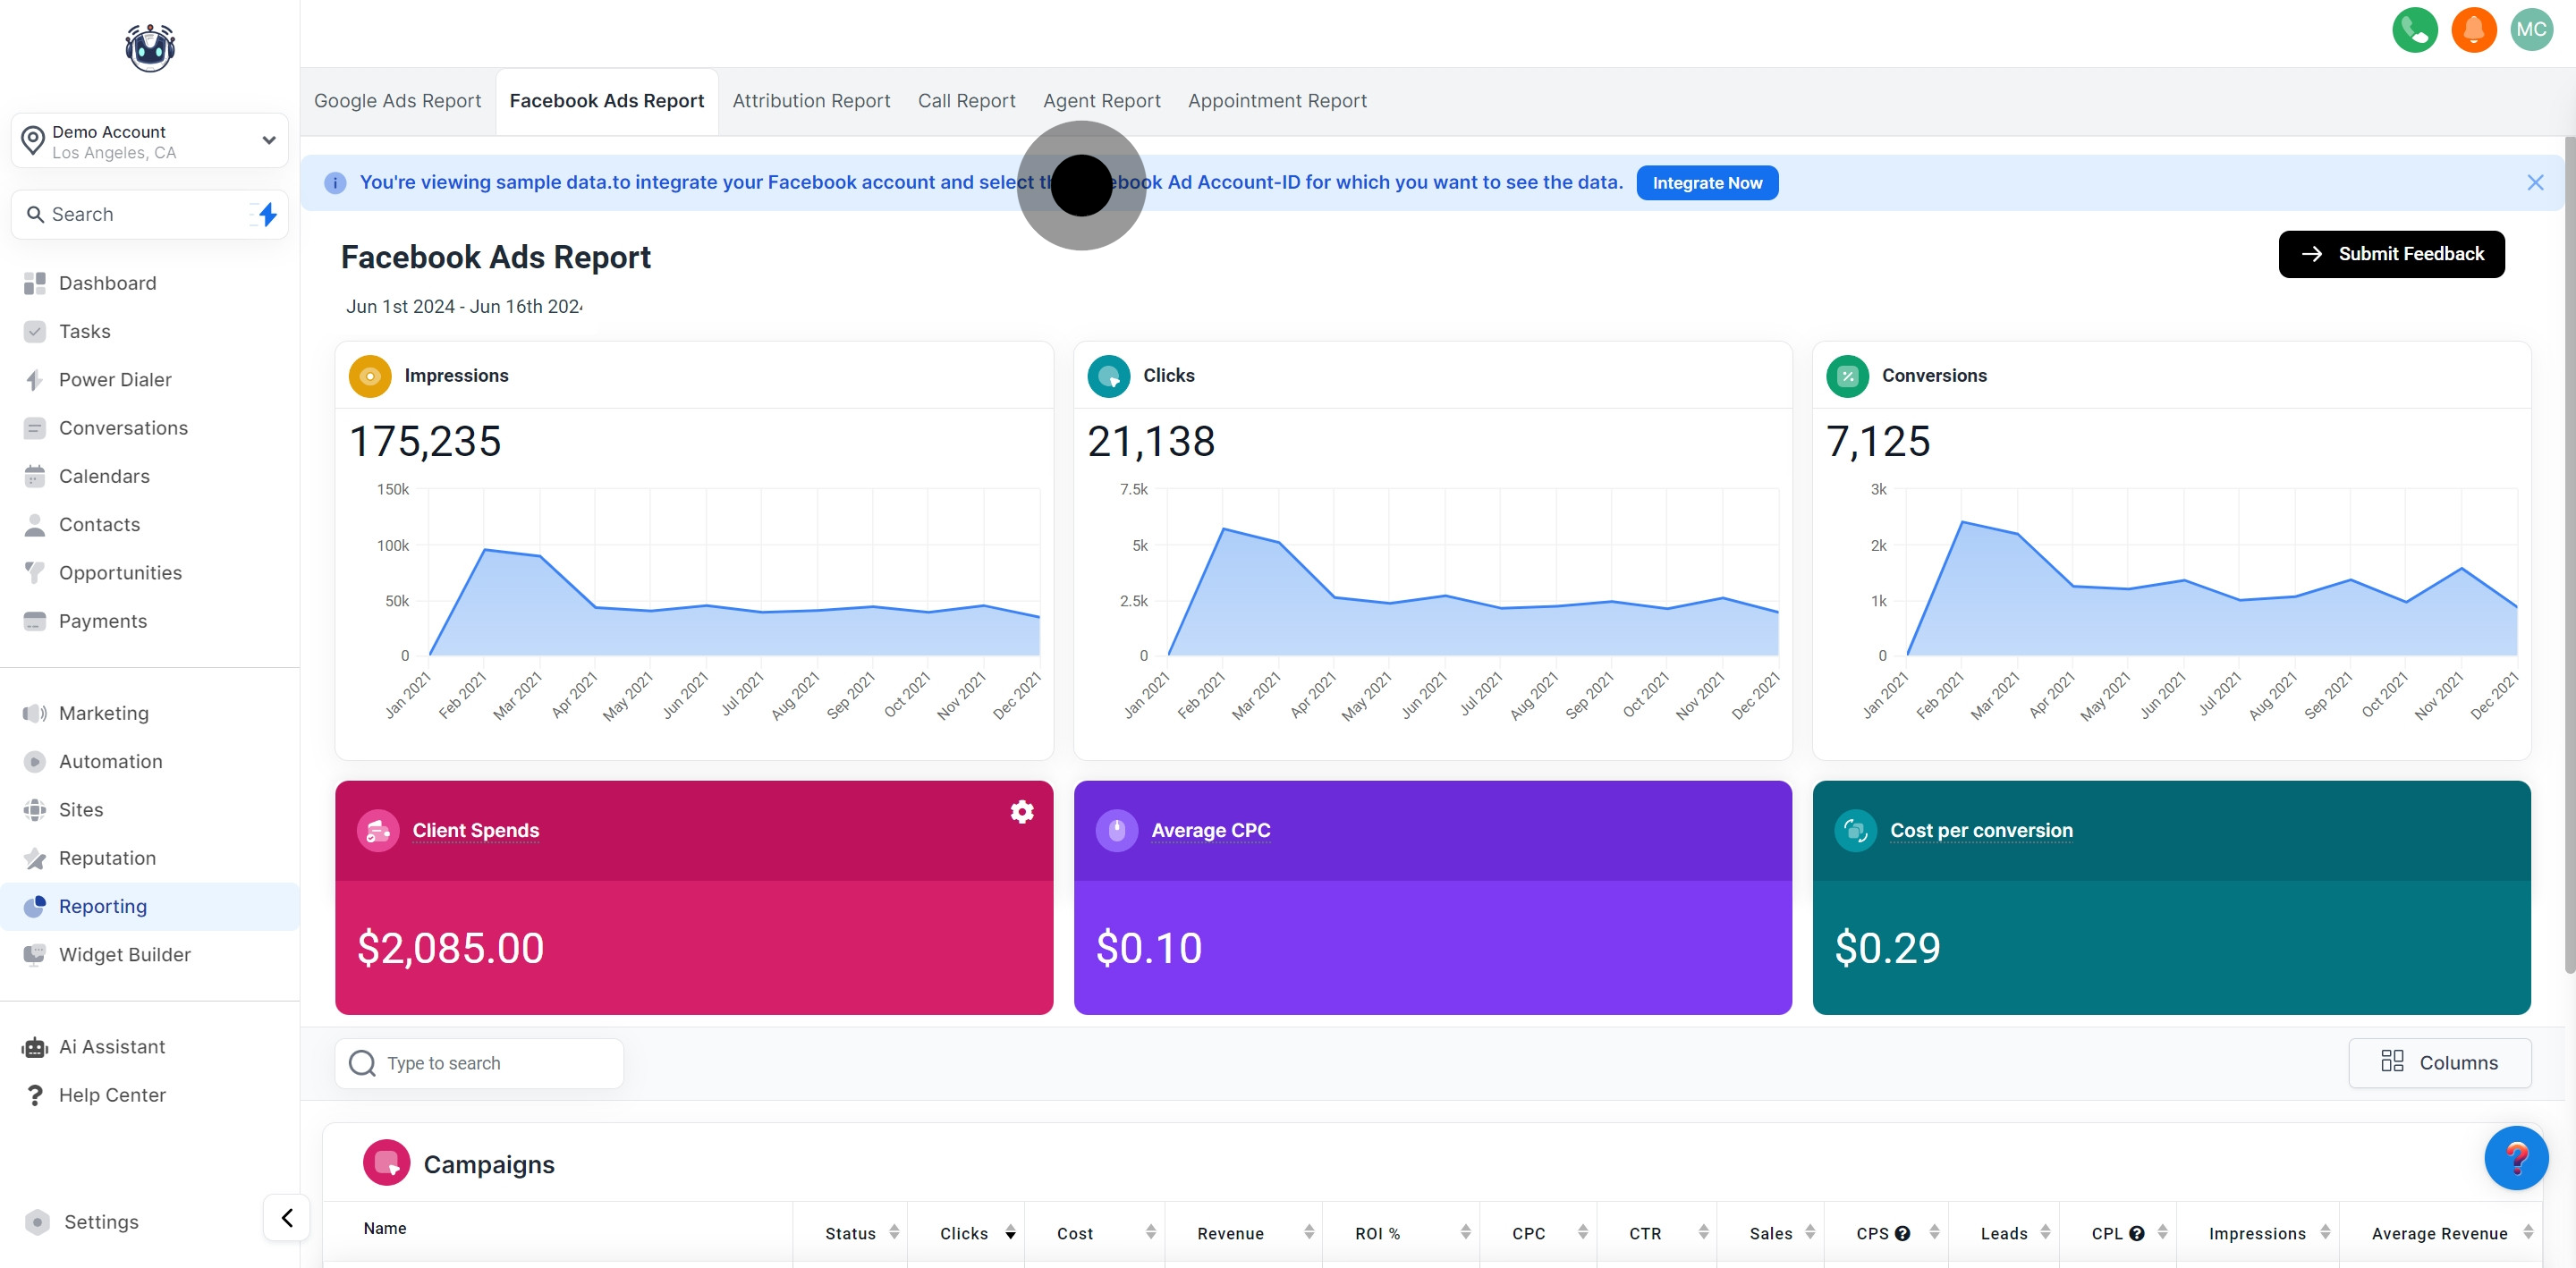
Currently, you're examining sample data. To access your actual Facebook Ads data, it's essential to integrate your Facebook account and synchronize your Ads data.
For precise analysis of advertising data, applying filters and defining specific date ranges are crucial. This ensures that the data being reviewed remains relevant and accurate. To set a date range, navigate to the calendar selector positioned at the top right, select your preferred dates, and then click the green checkmark button. This action will update your Facebook Ads data to match your chosen date range!
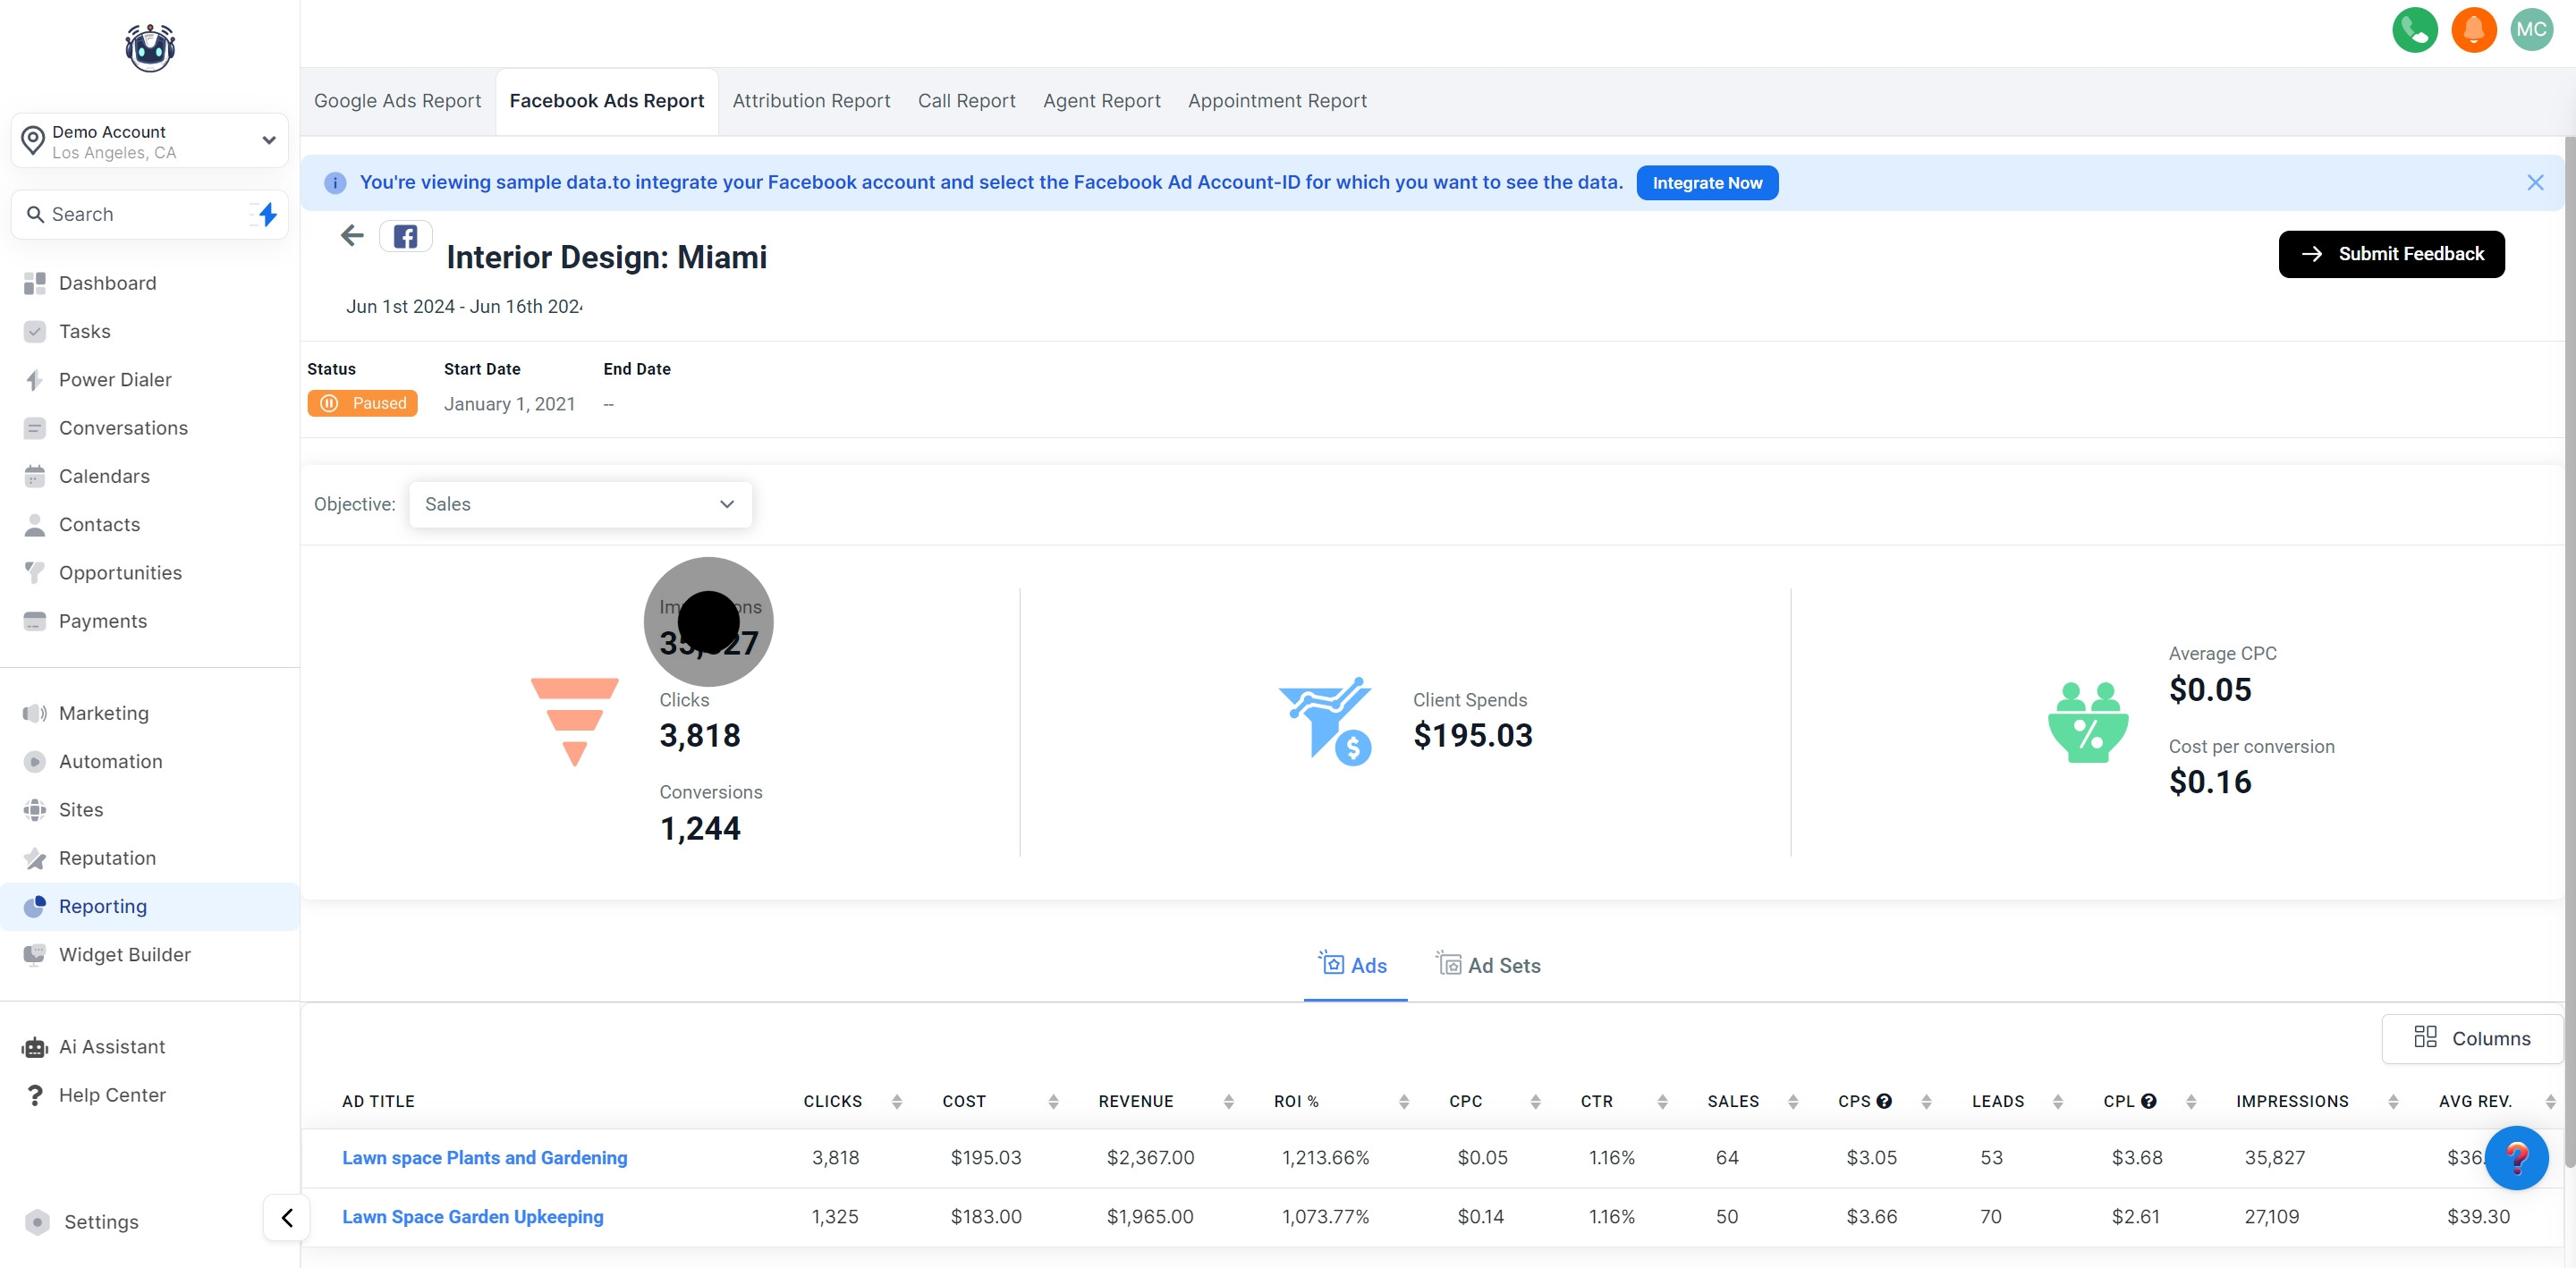
In the Campaign Impressions Timeline section, you can observe a timeline of your total impressions at the campaign level, based on the selected date range.
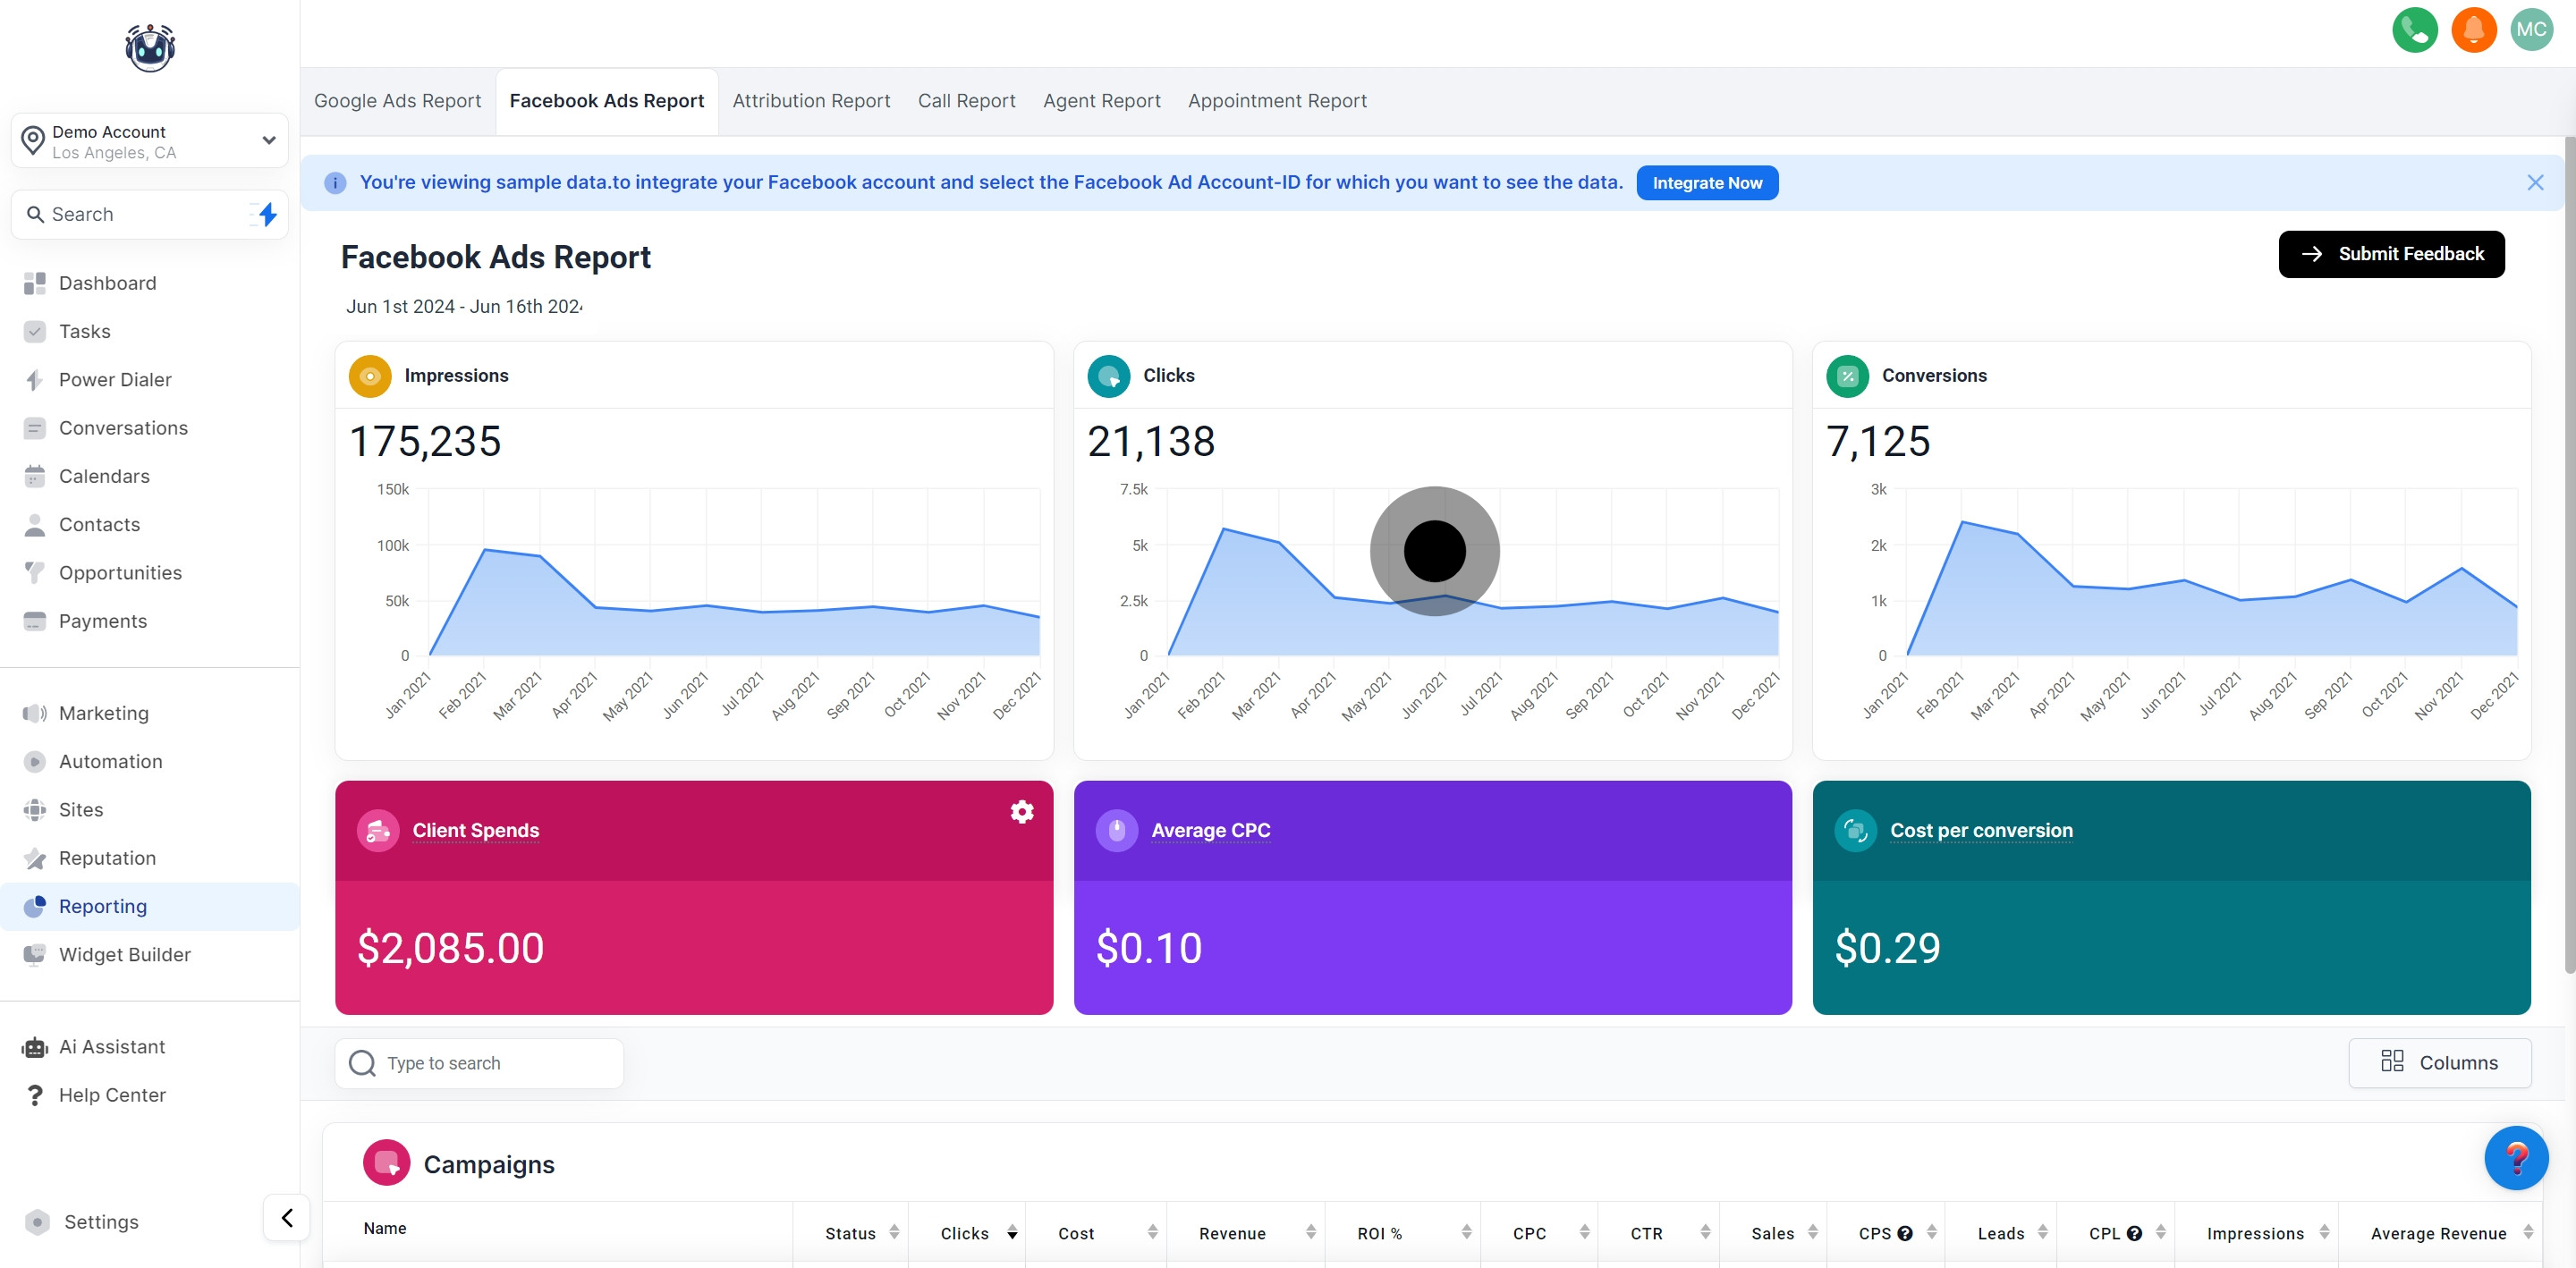
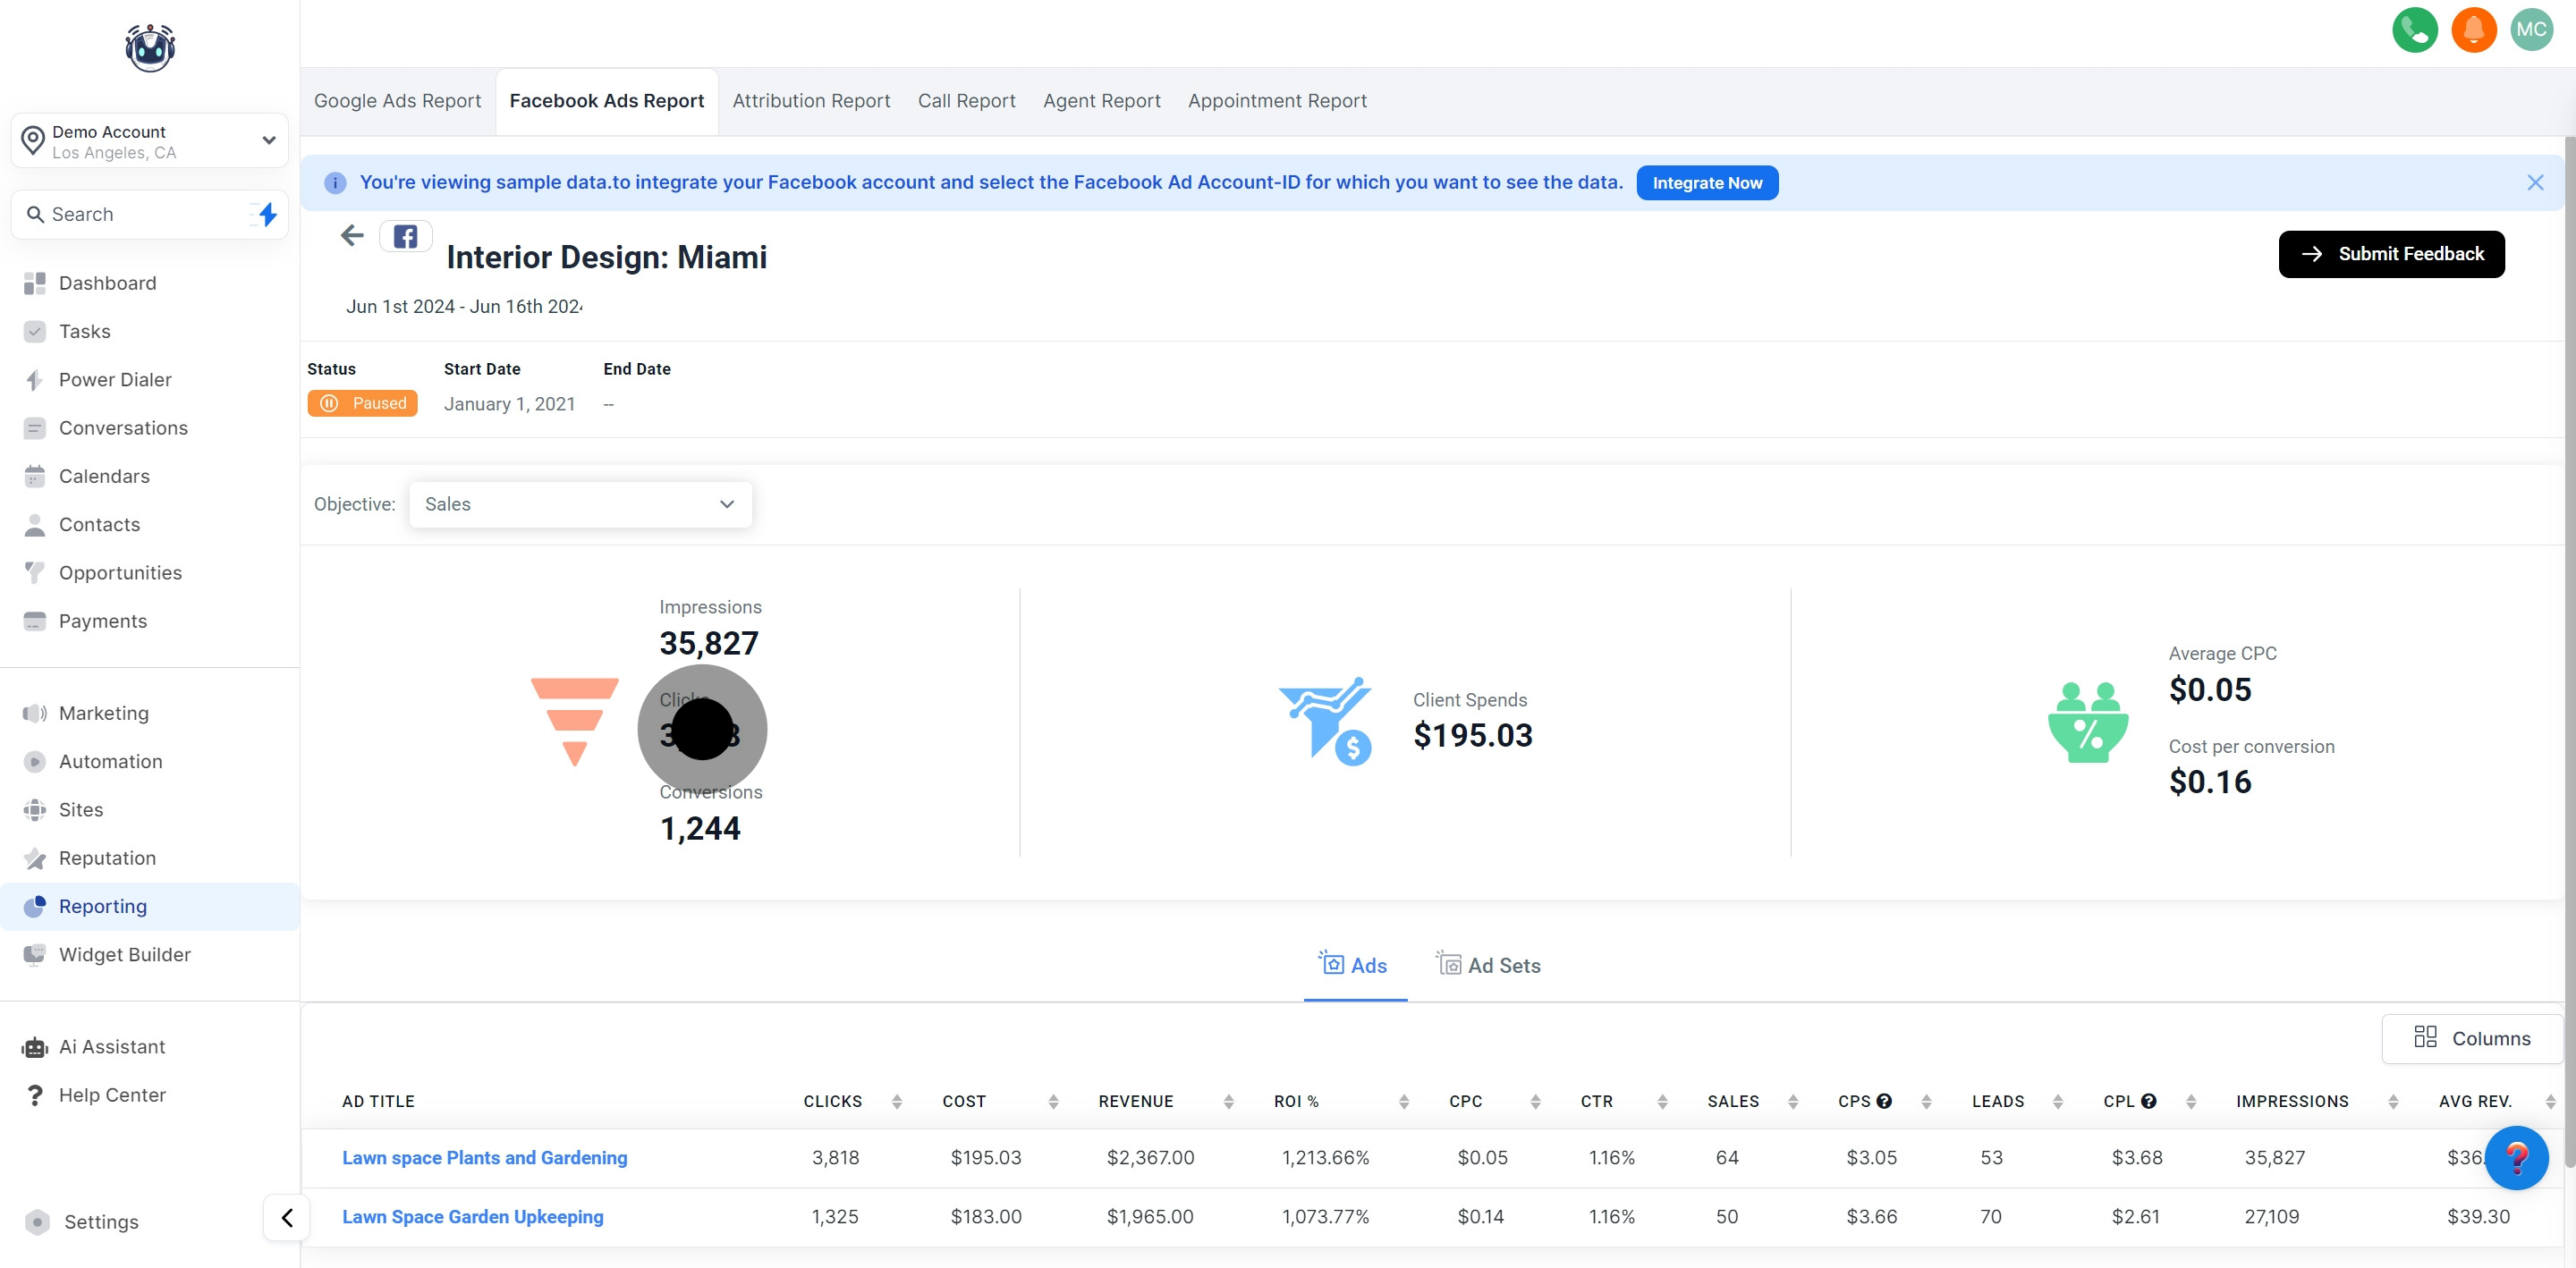
The Clicks section displays the number of times users clicked on your Facebook ad after it appeared on their search results page. It also provides a graphical representation of your clicks per day, week, or month based on the chosen date range.
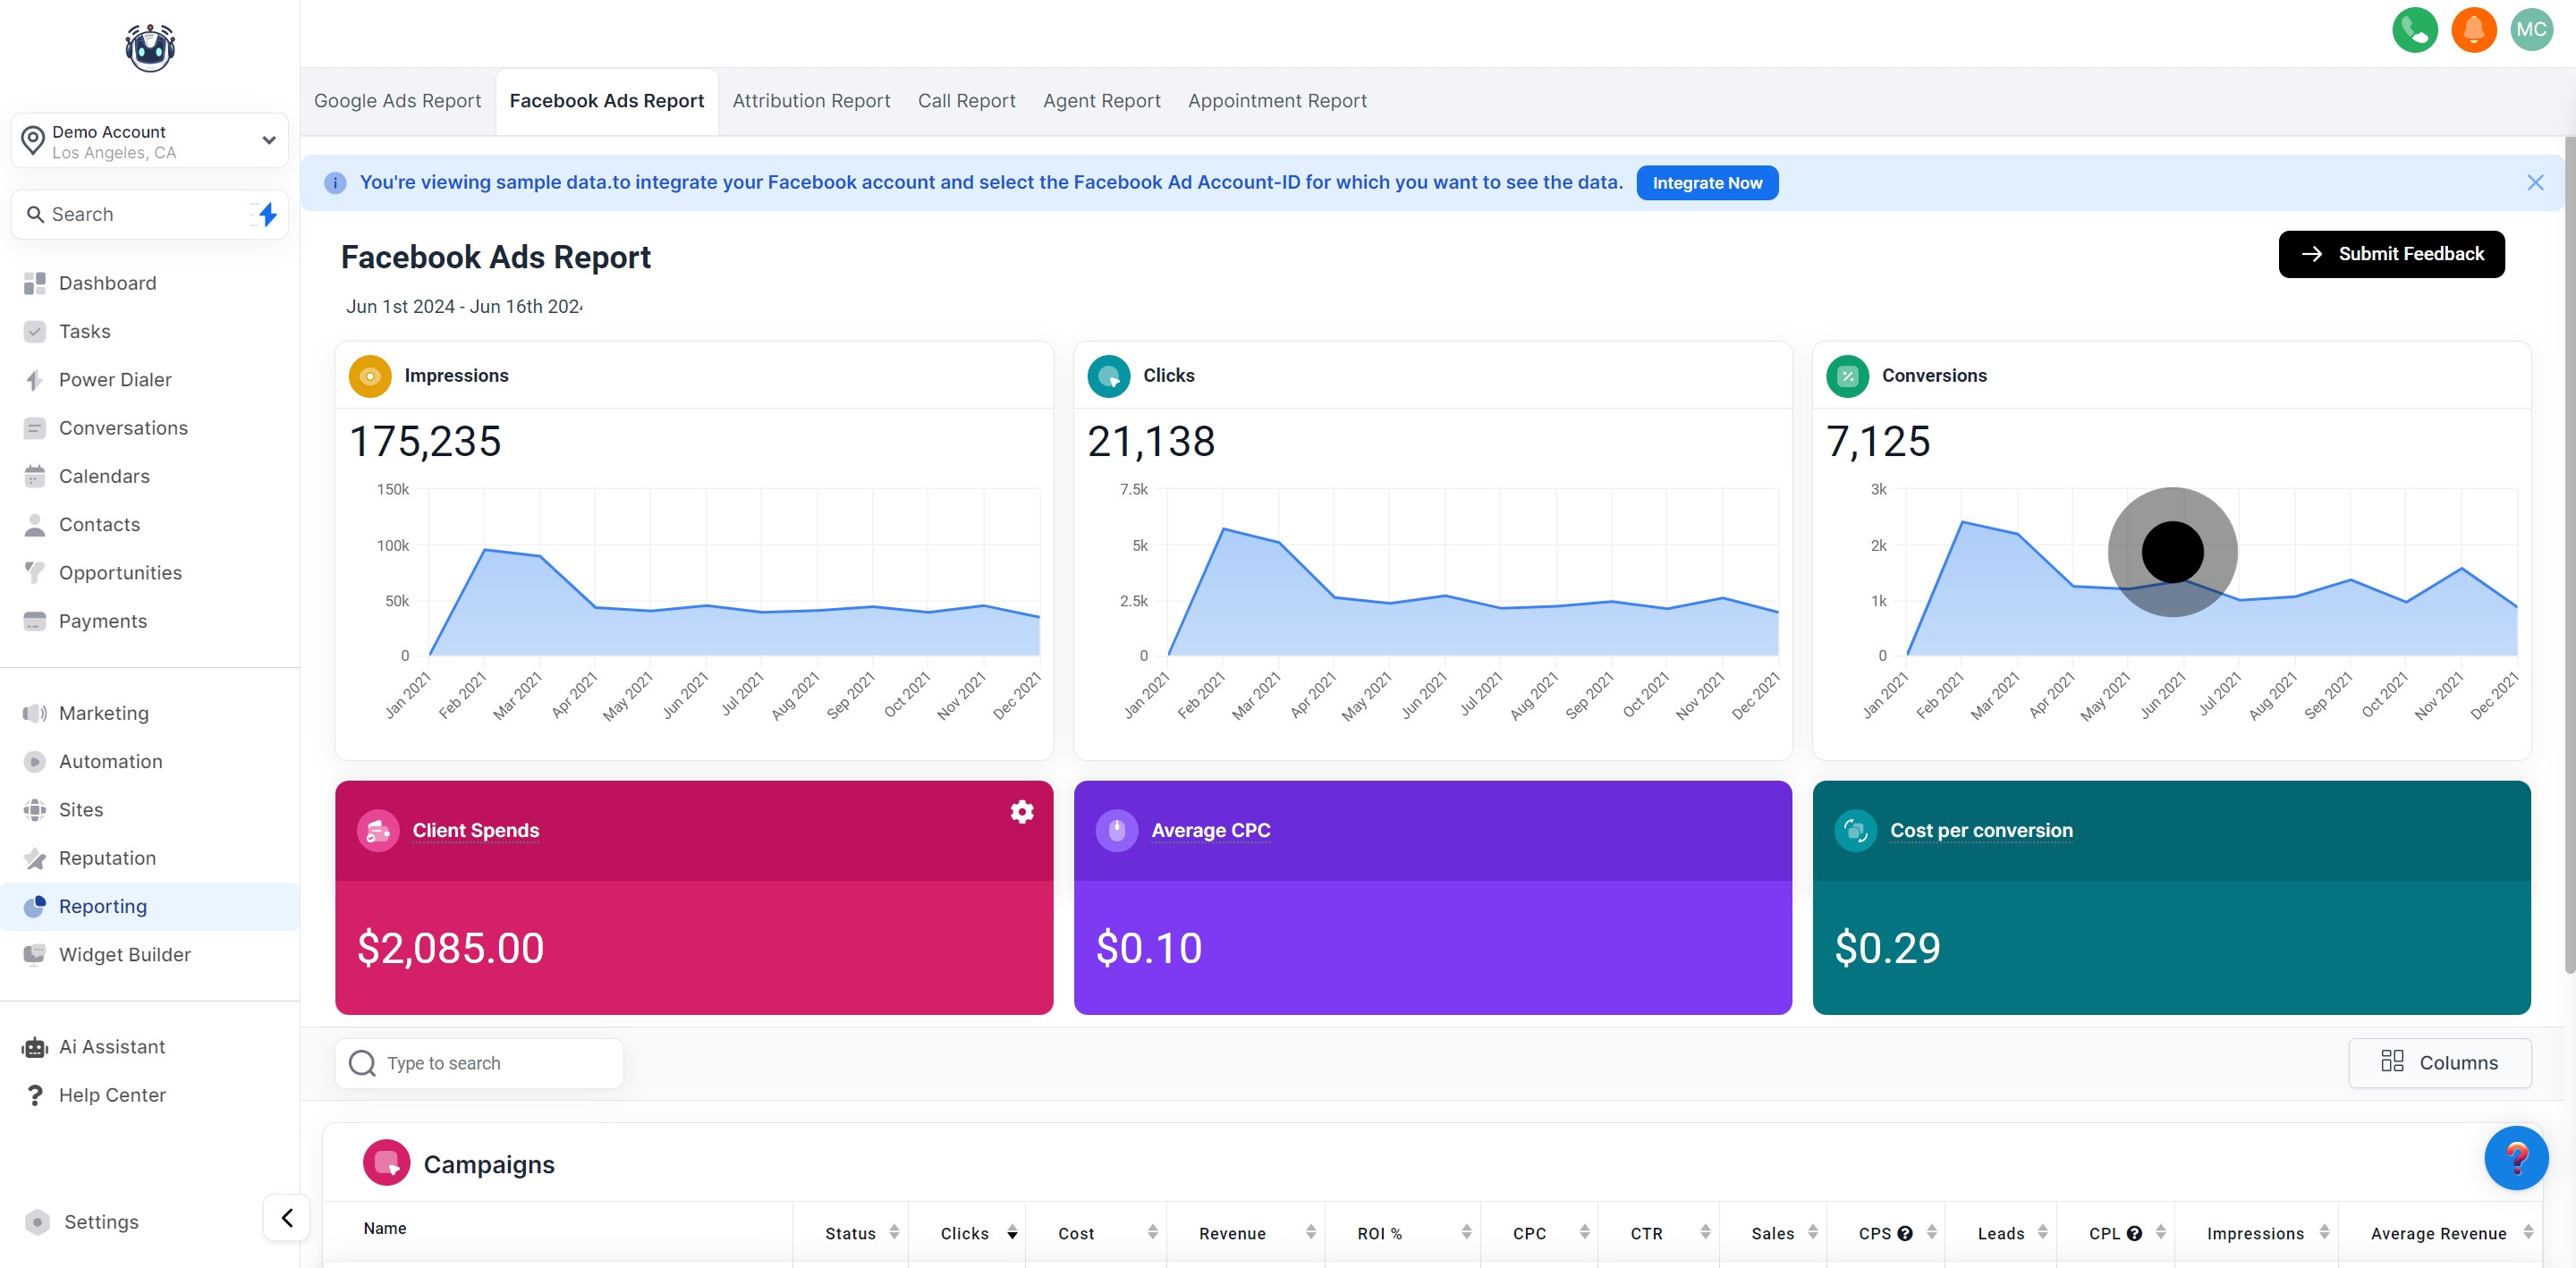
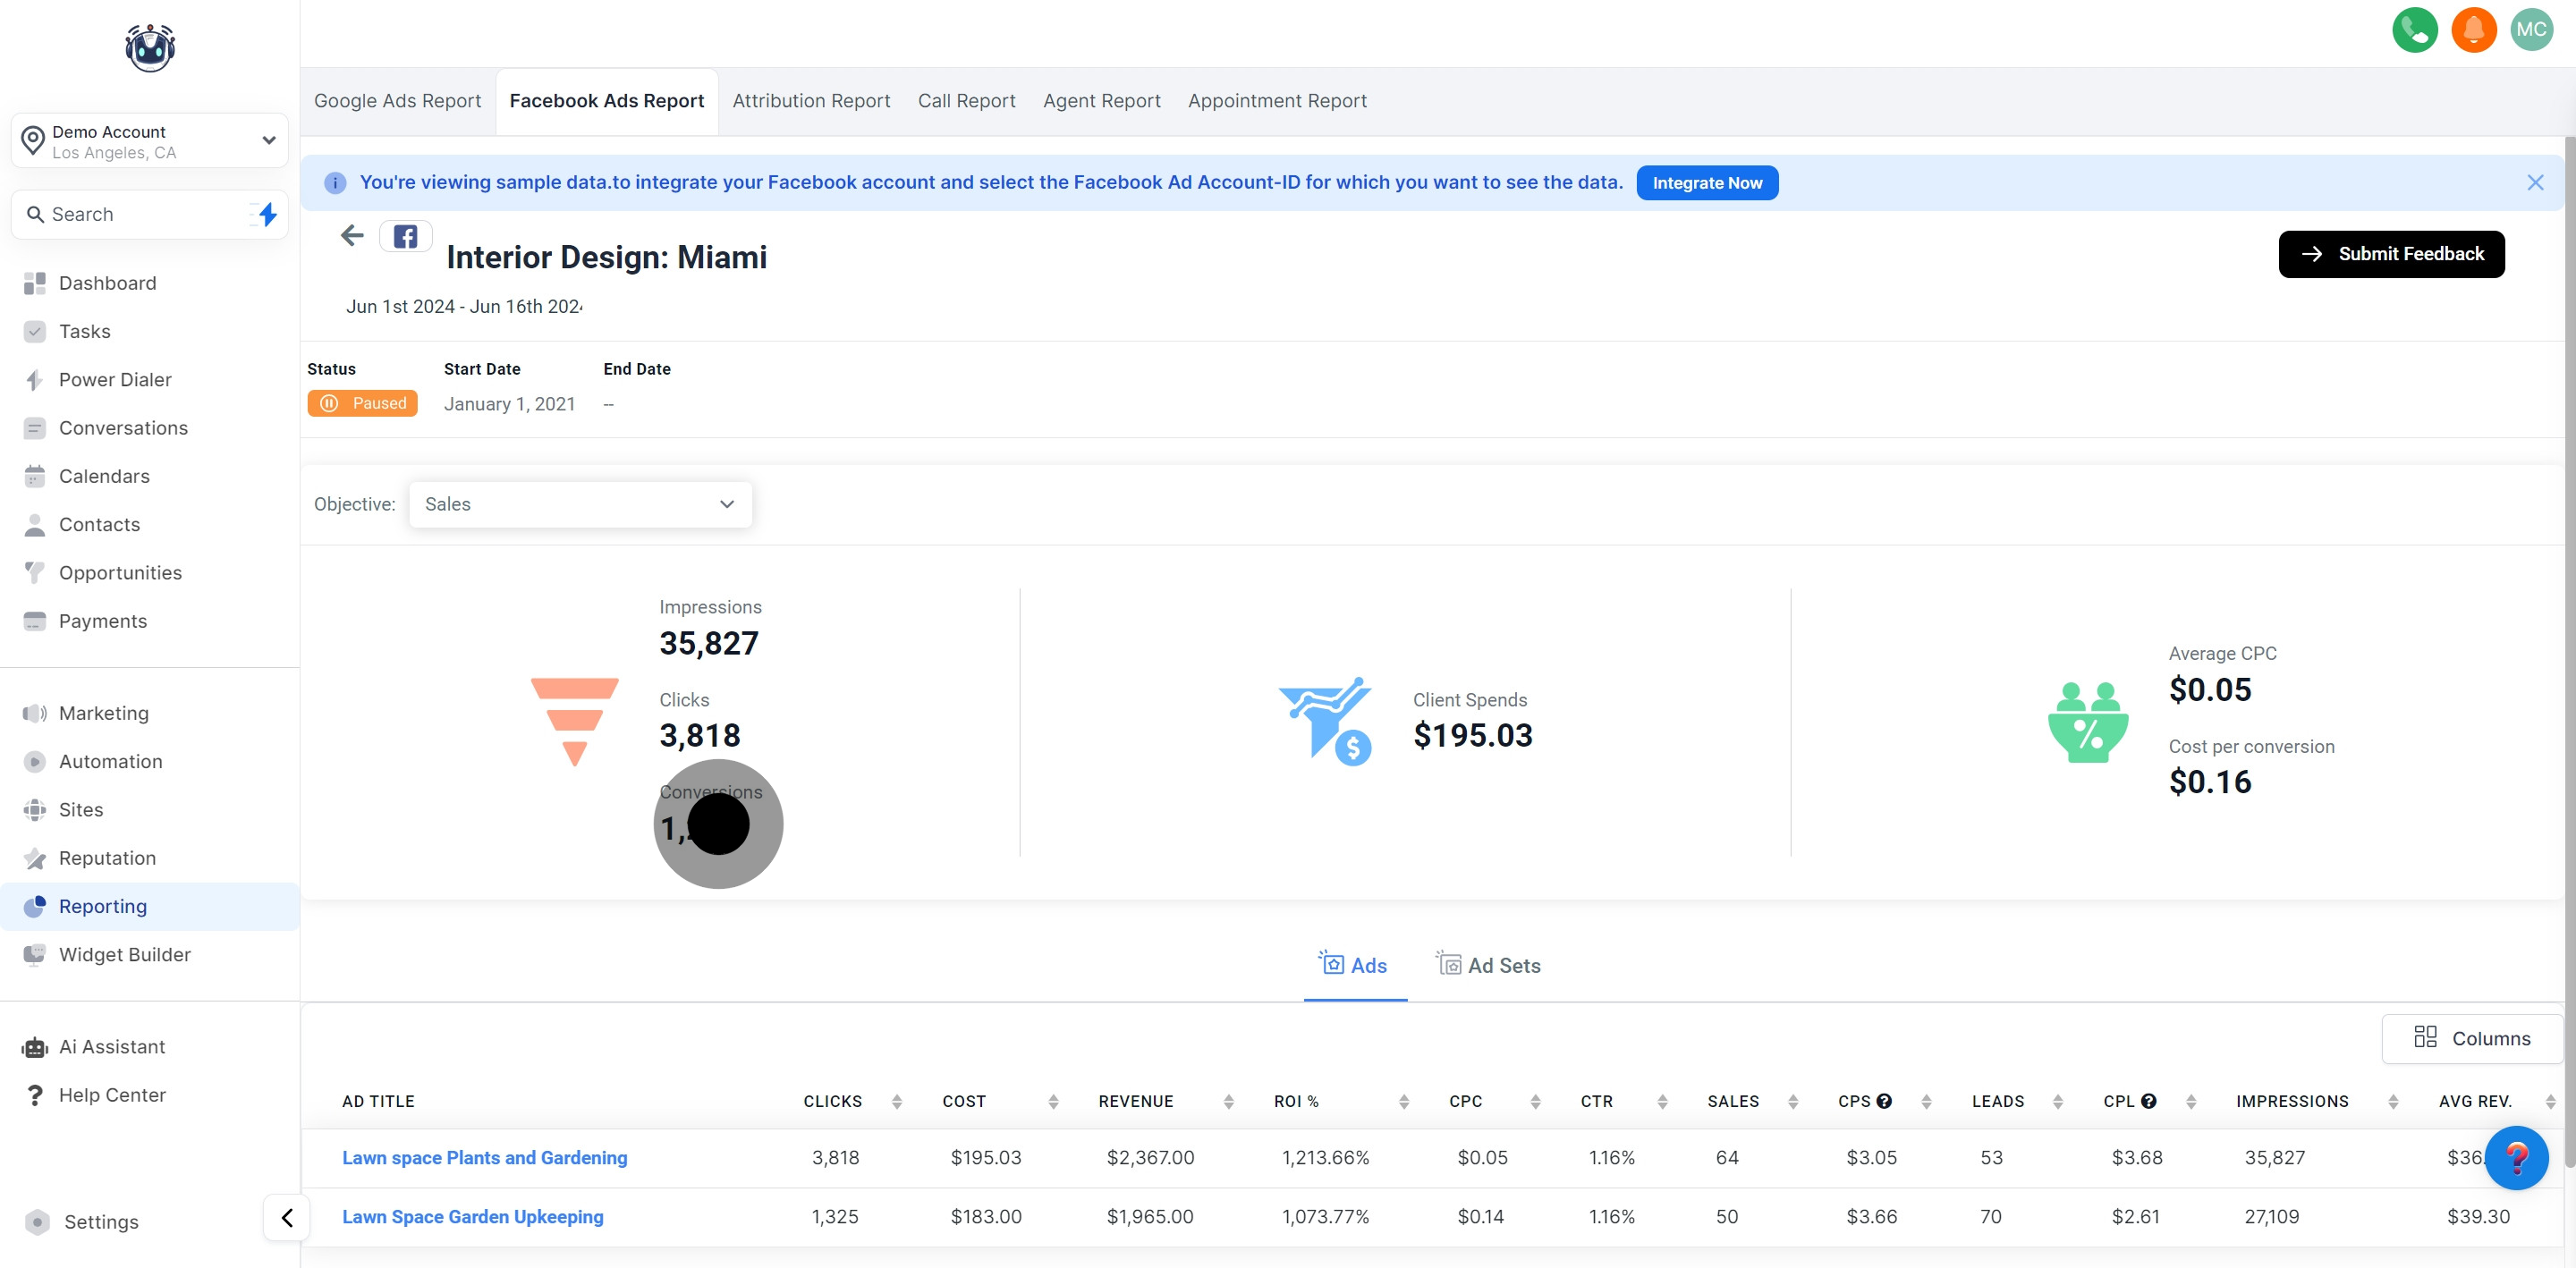
Within the Conversions section, you'll find the count of users who took a specific action aligned with your ad's goal during the set time window. You can observe a graphical representation of your conversions per day, week, or year based on the selected date range.
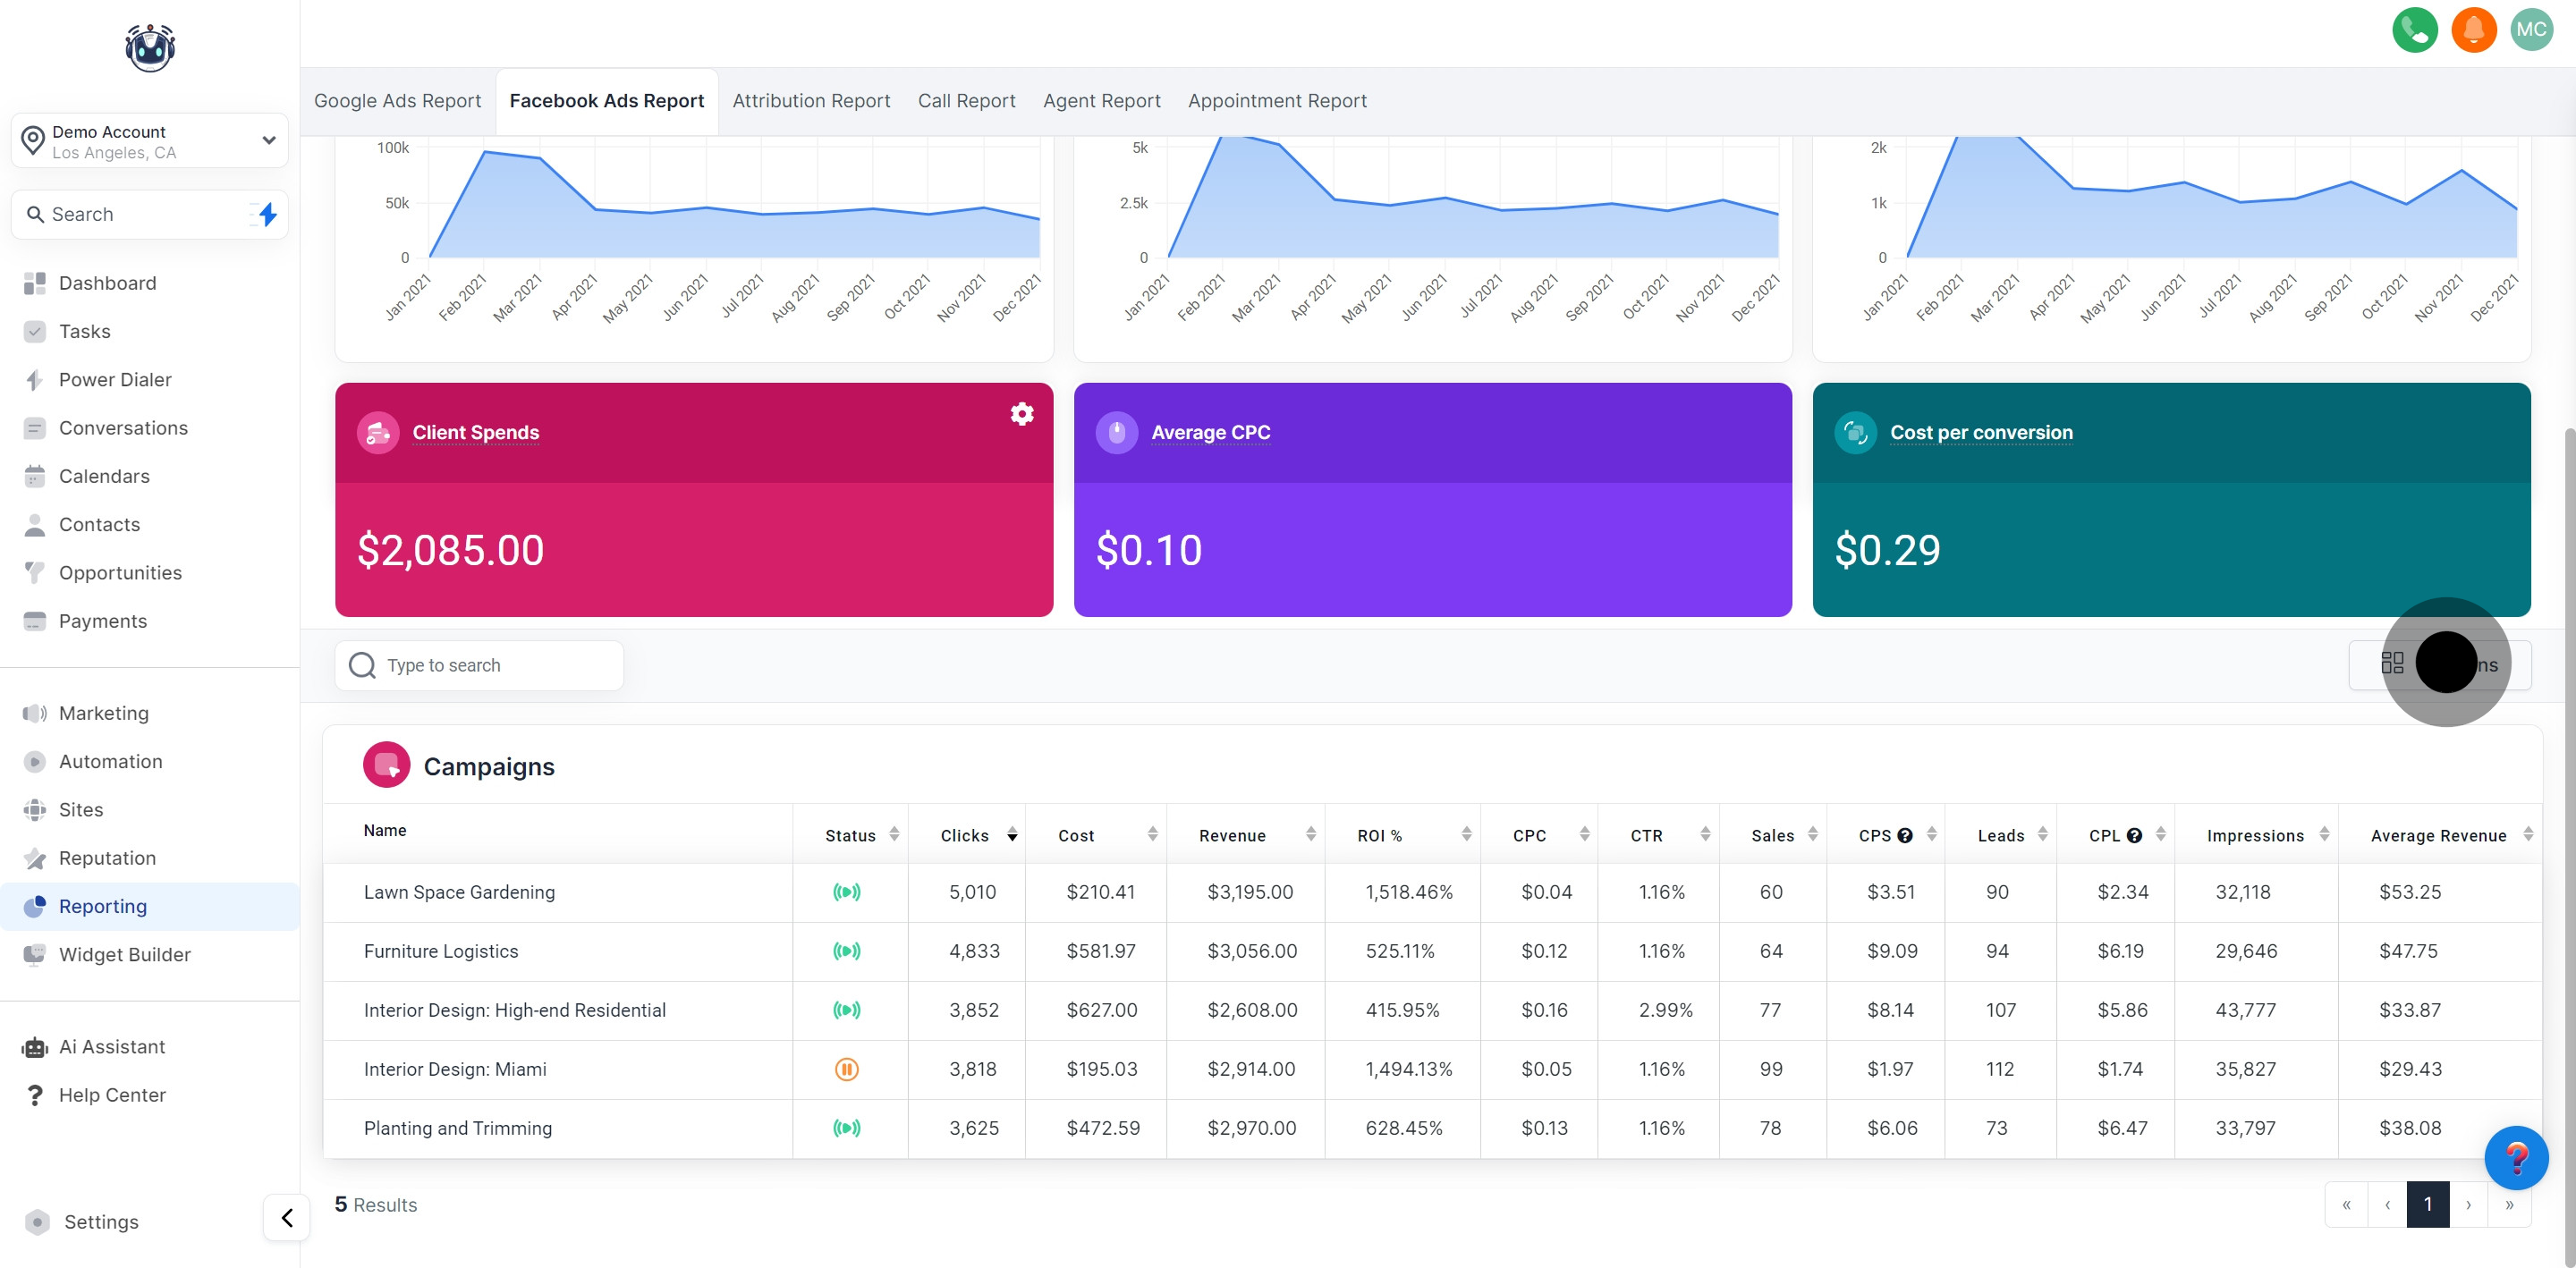
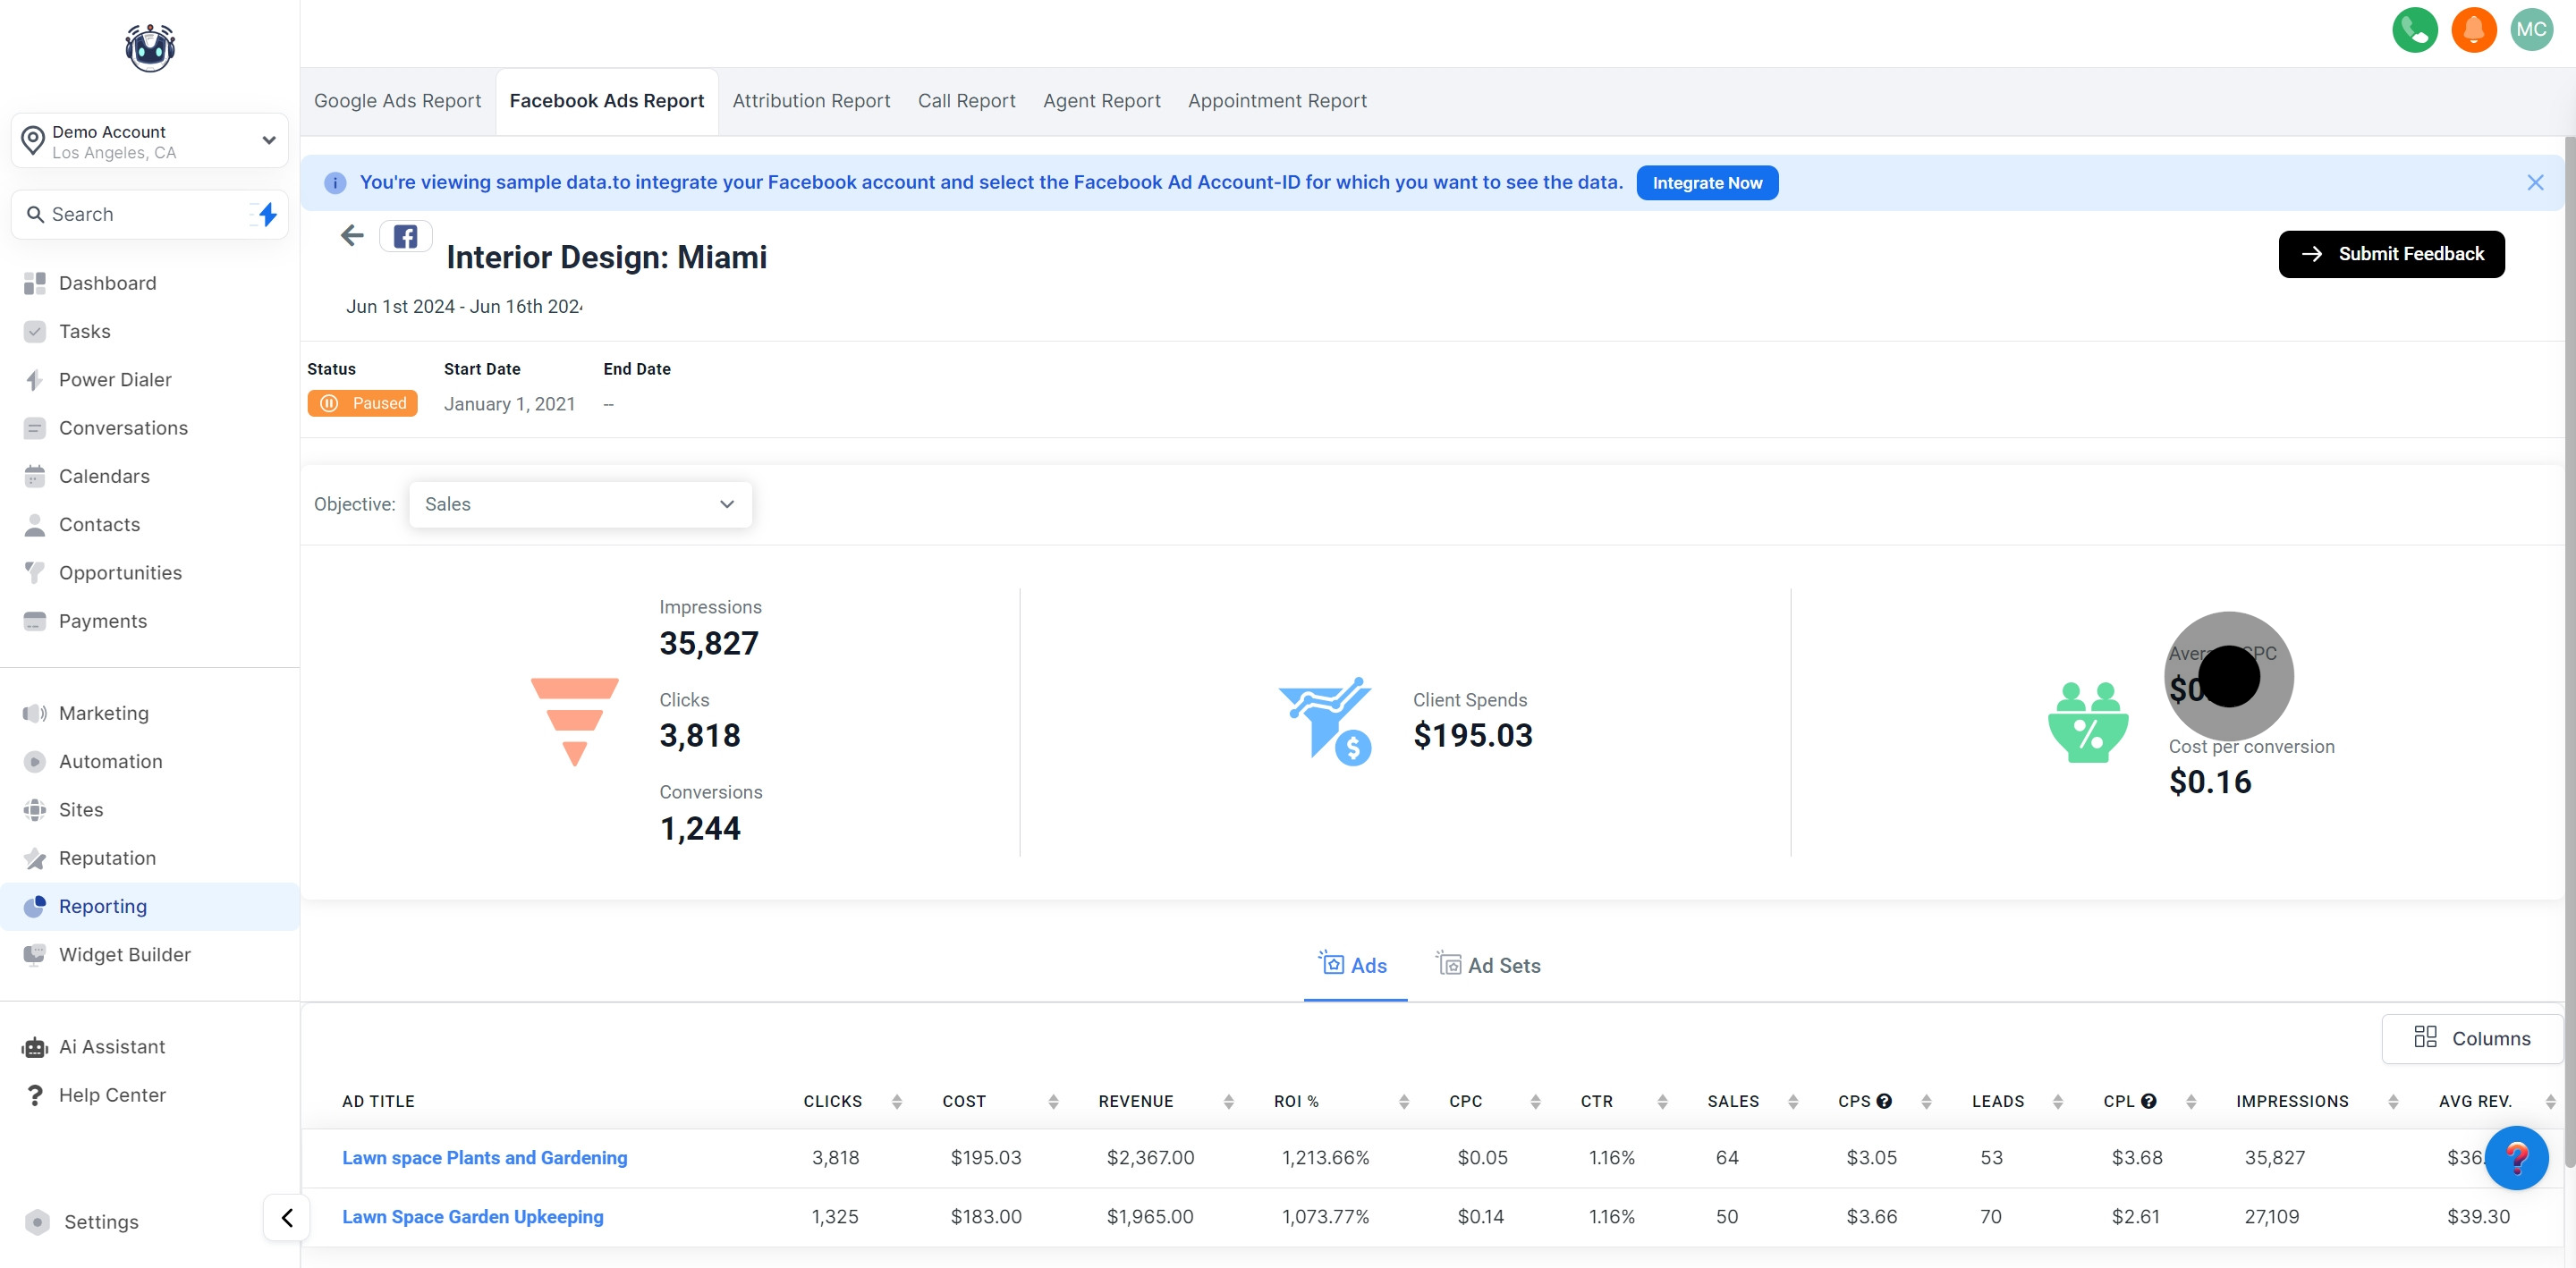
This section shows the expenditure incurred on a particular advertisement.
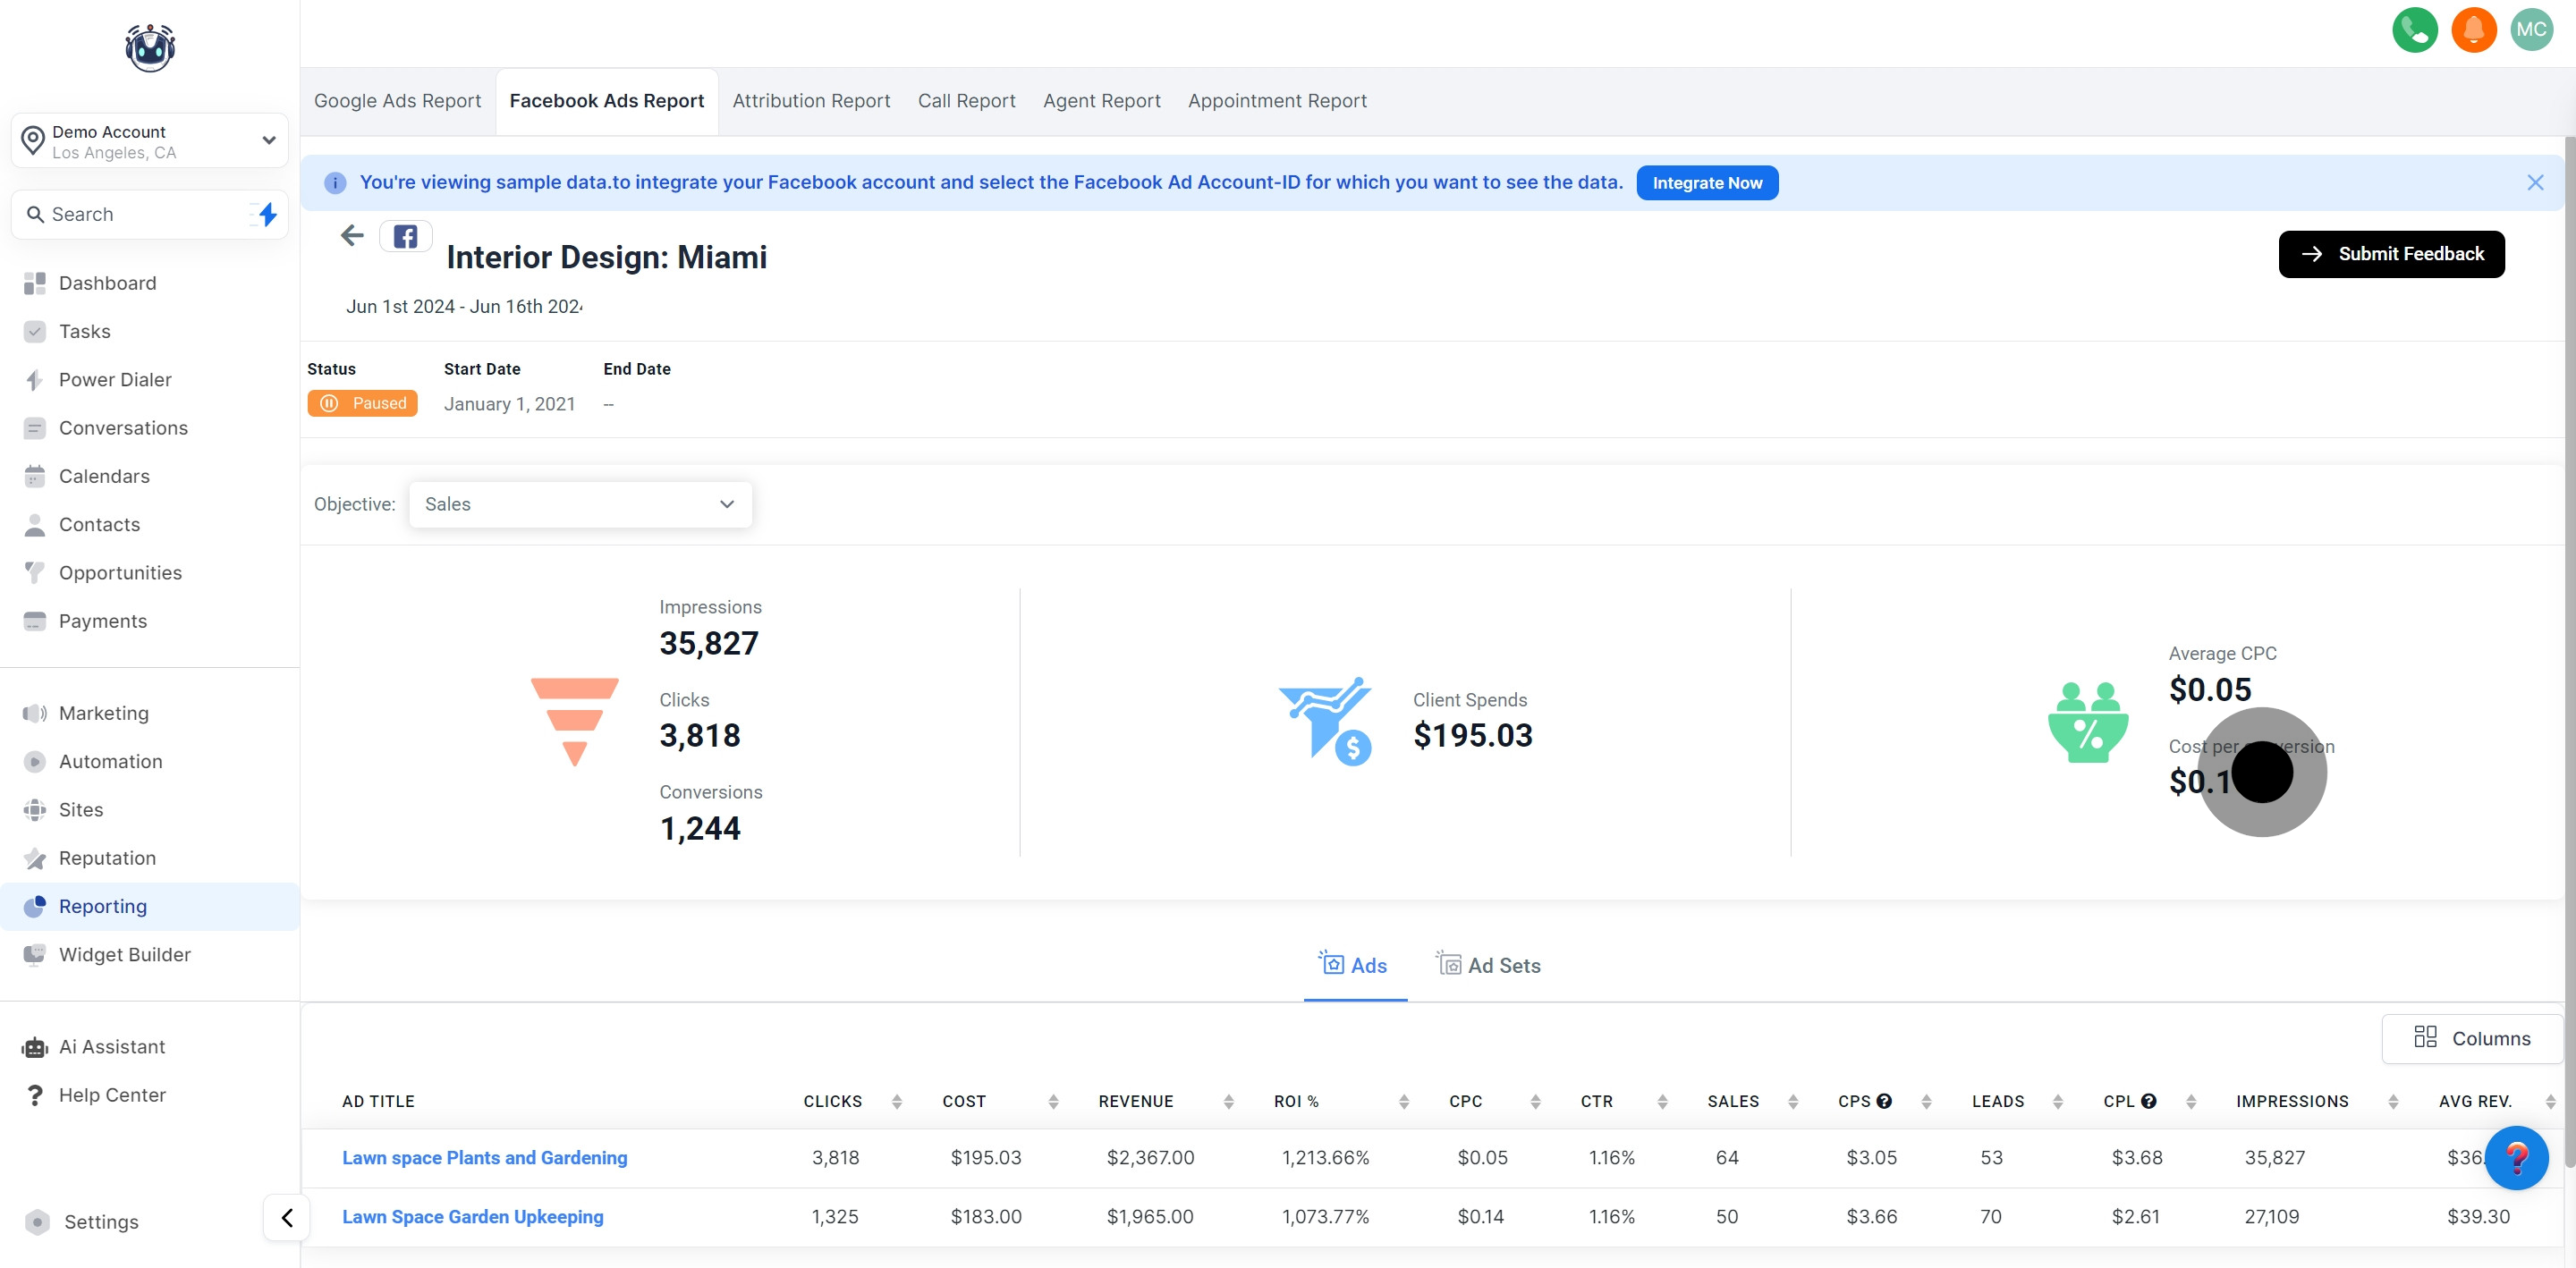
It indicates the average cost for each click.

Displays the average cost for each conversion.
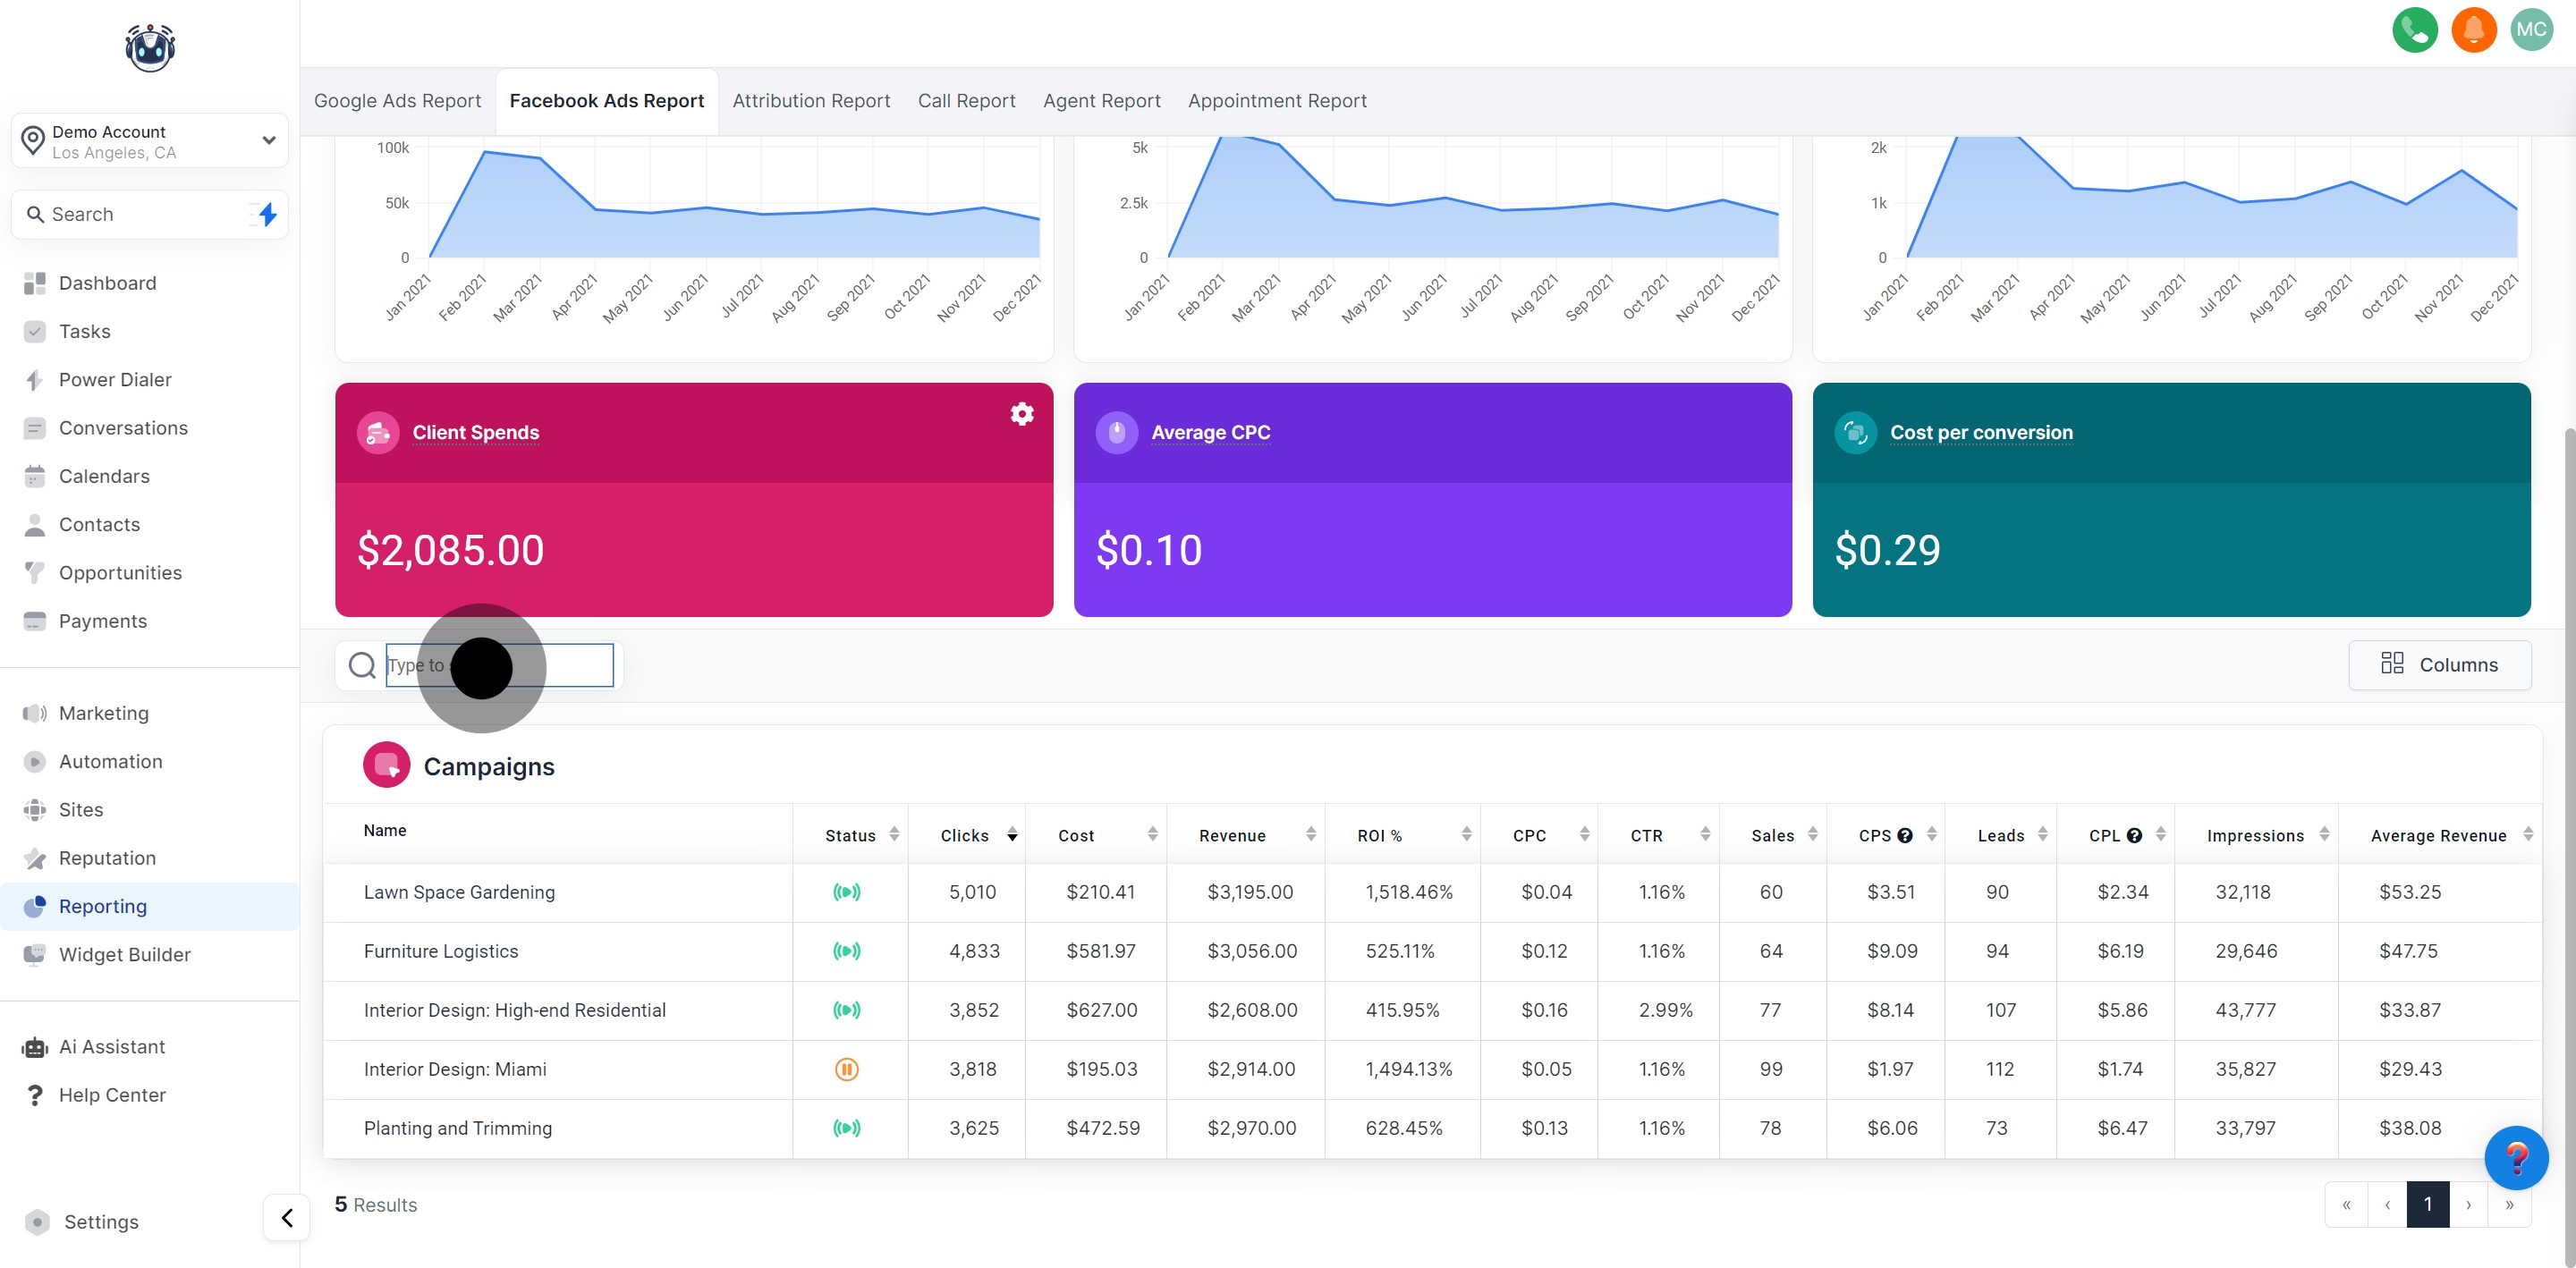
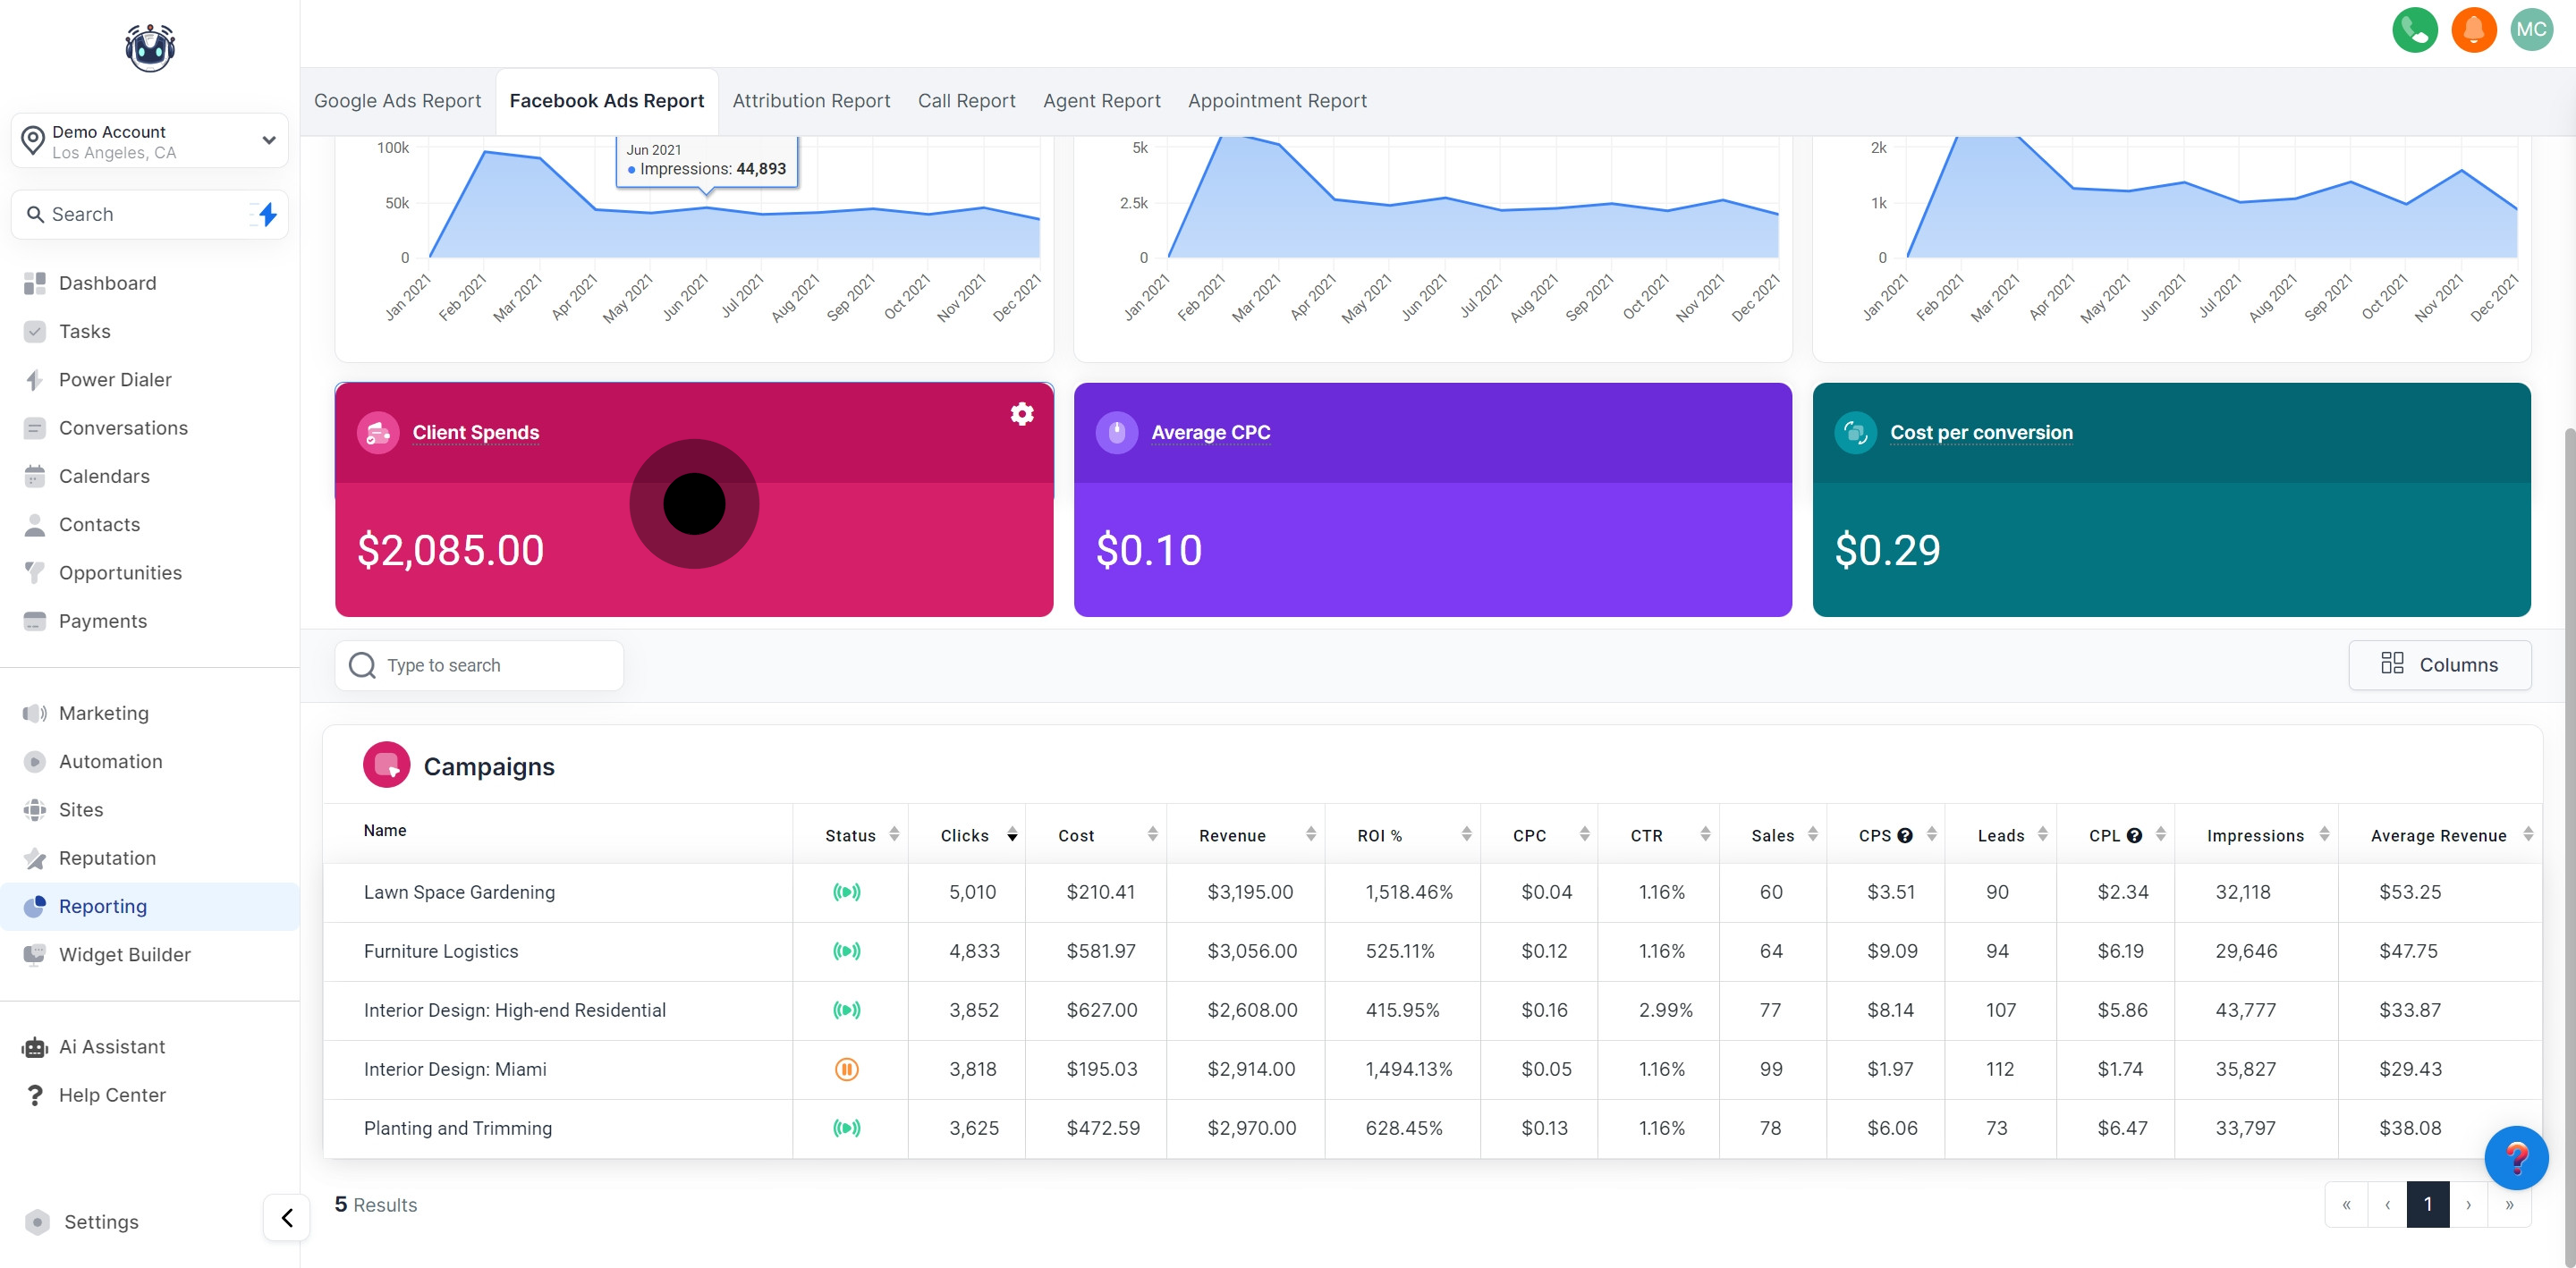
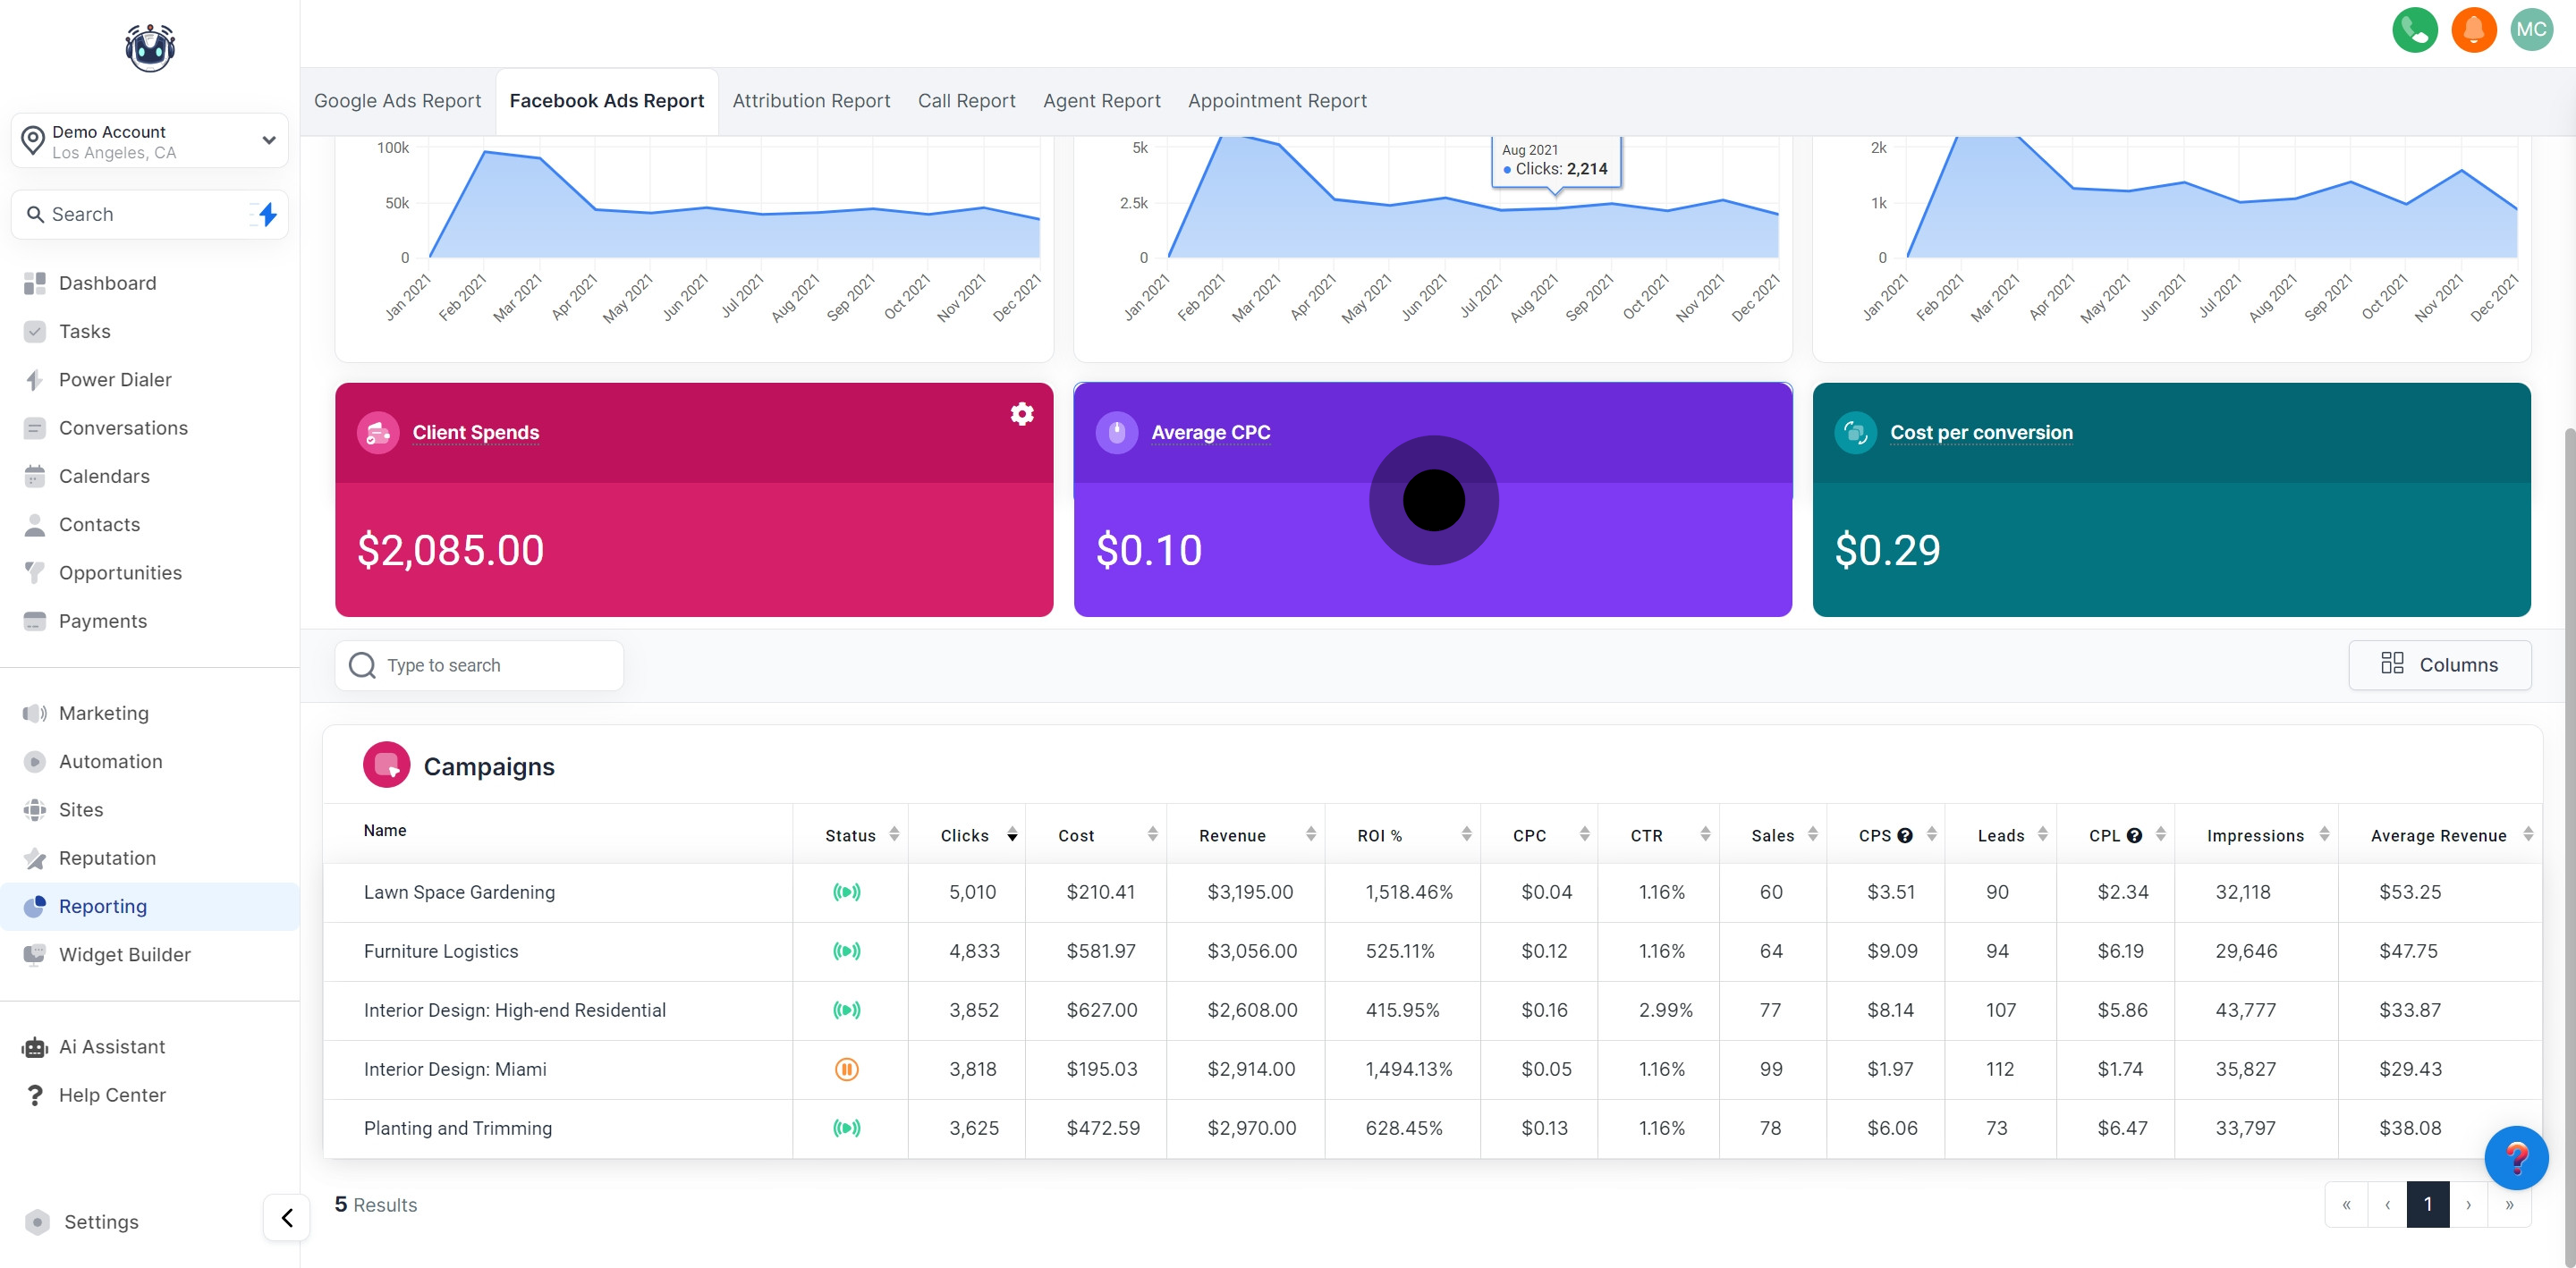
The Search Bar allows swift retrieval of a specific Facebook ad campaign. Simply enter the campaign name you wish to see, and the other campaigns will disappear from the campaign data card.
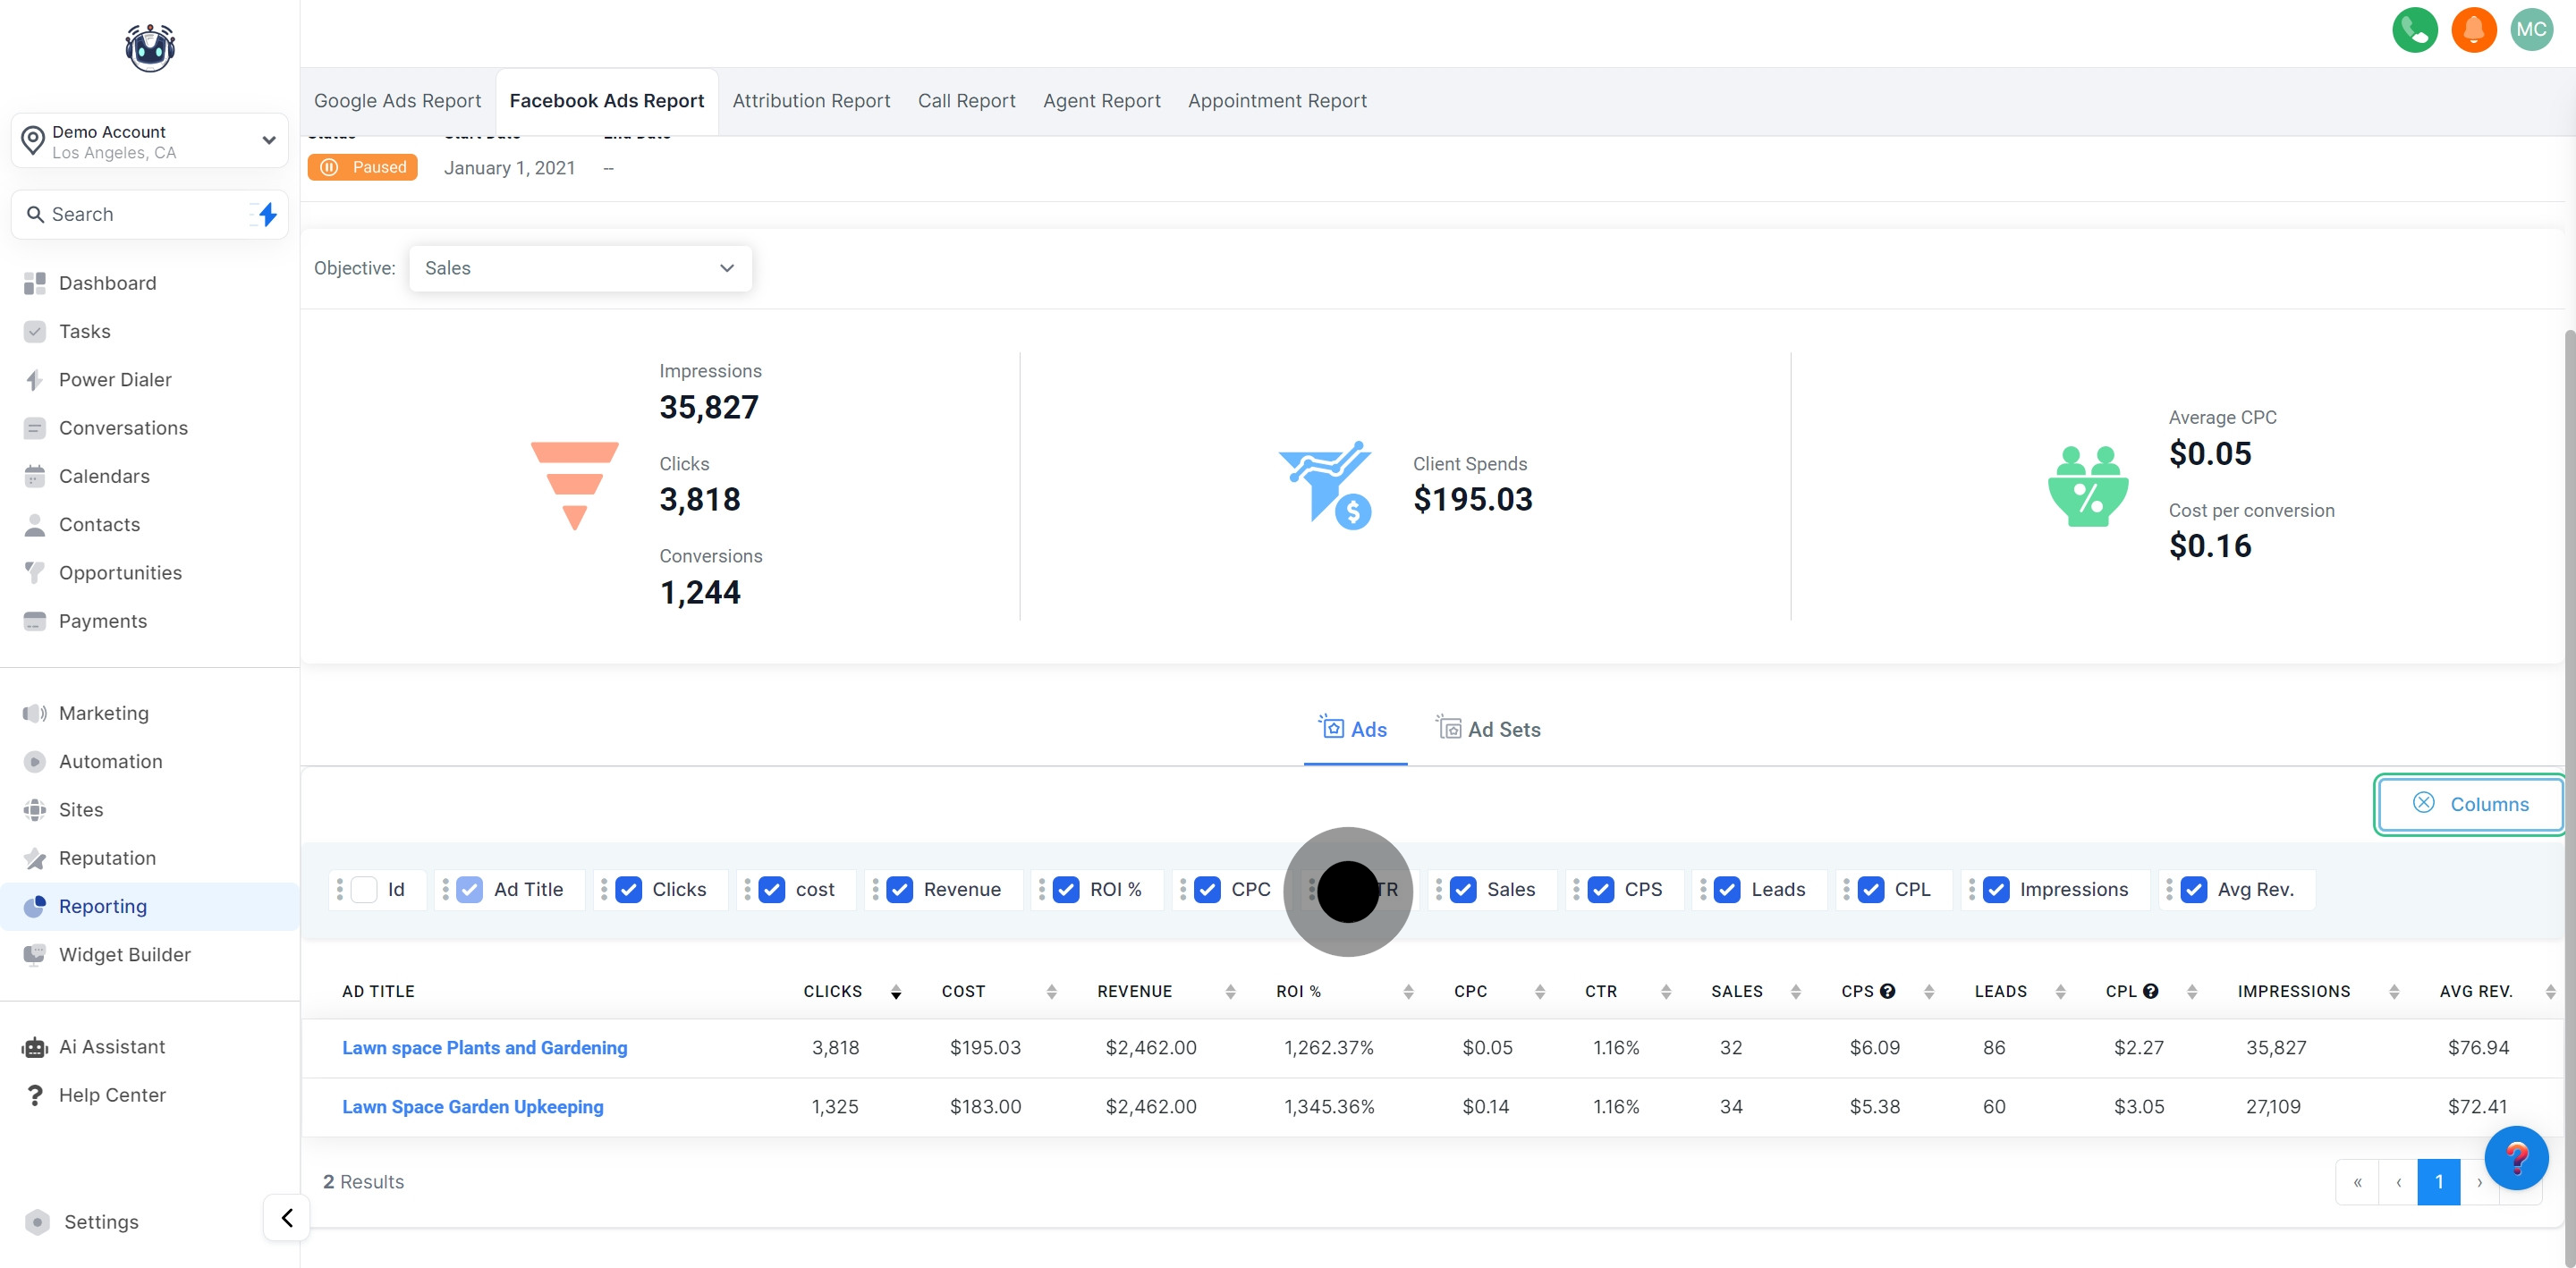
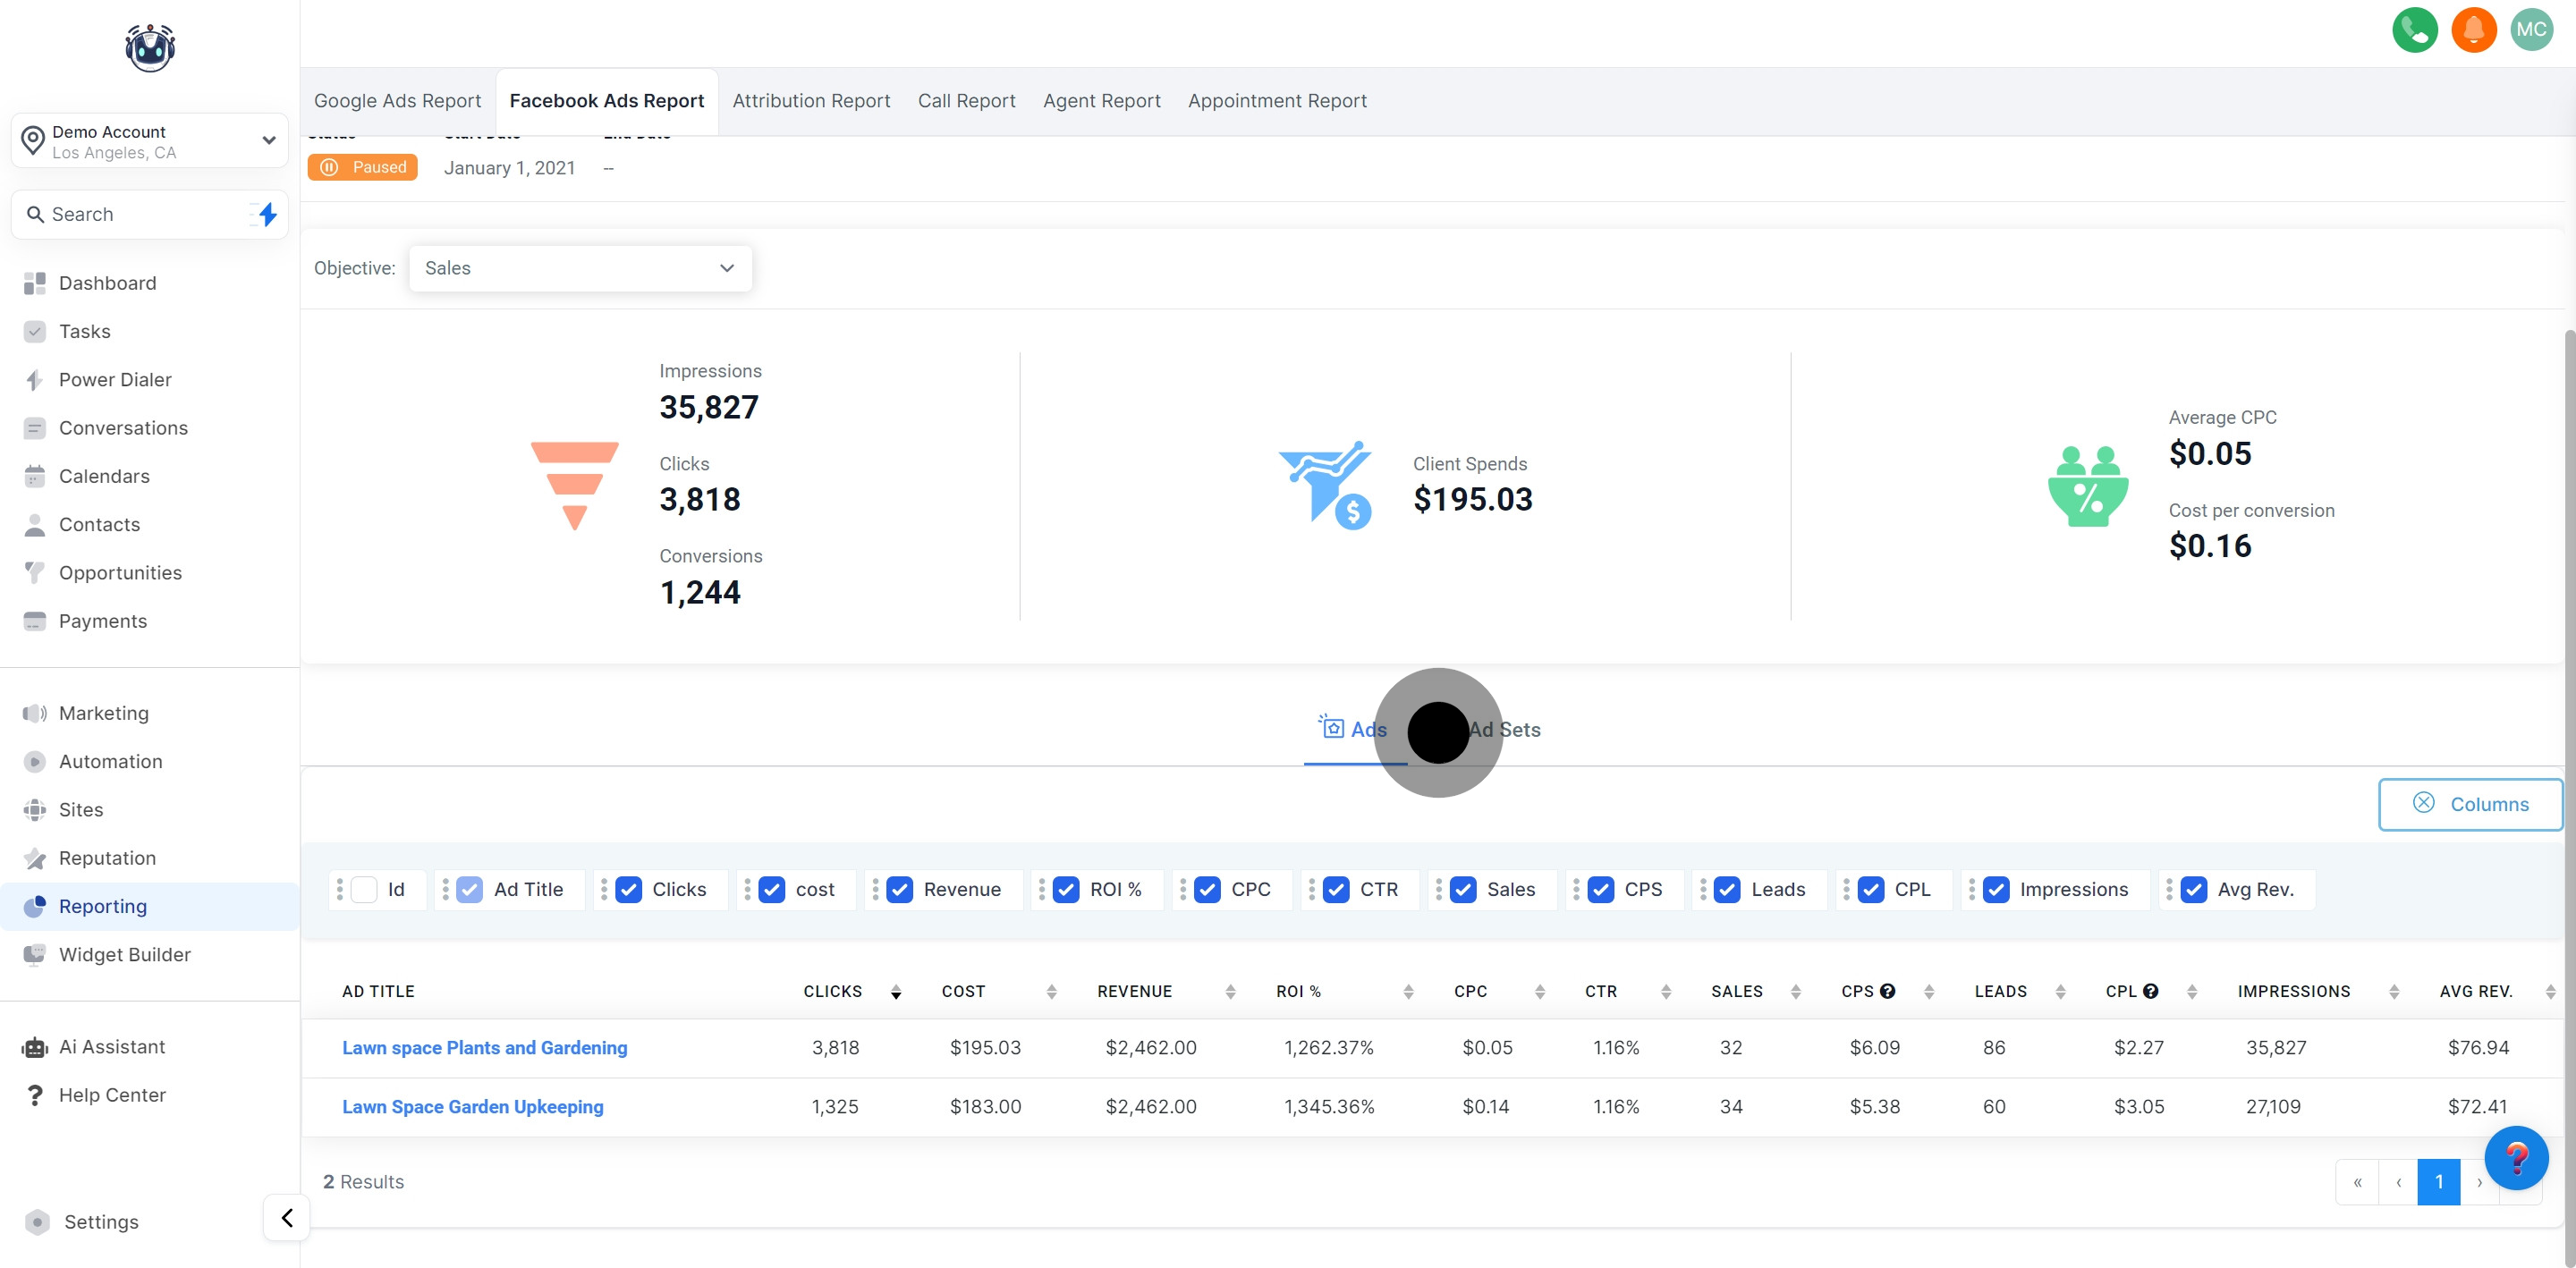
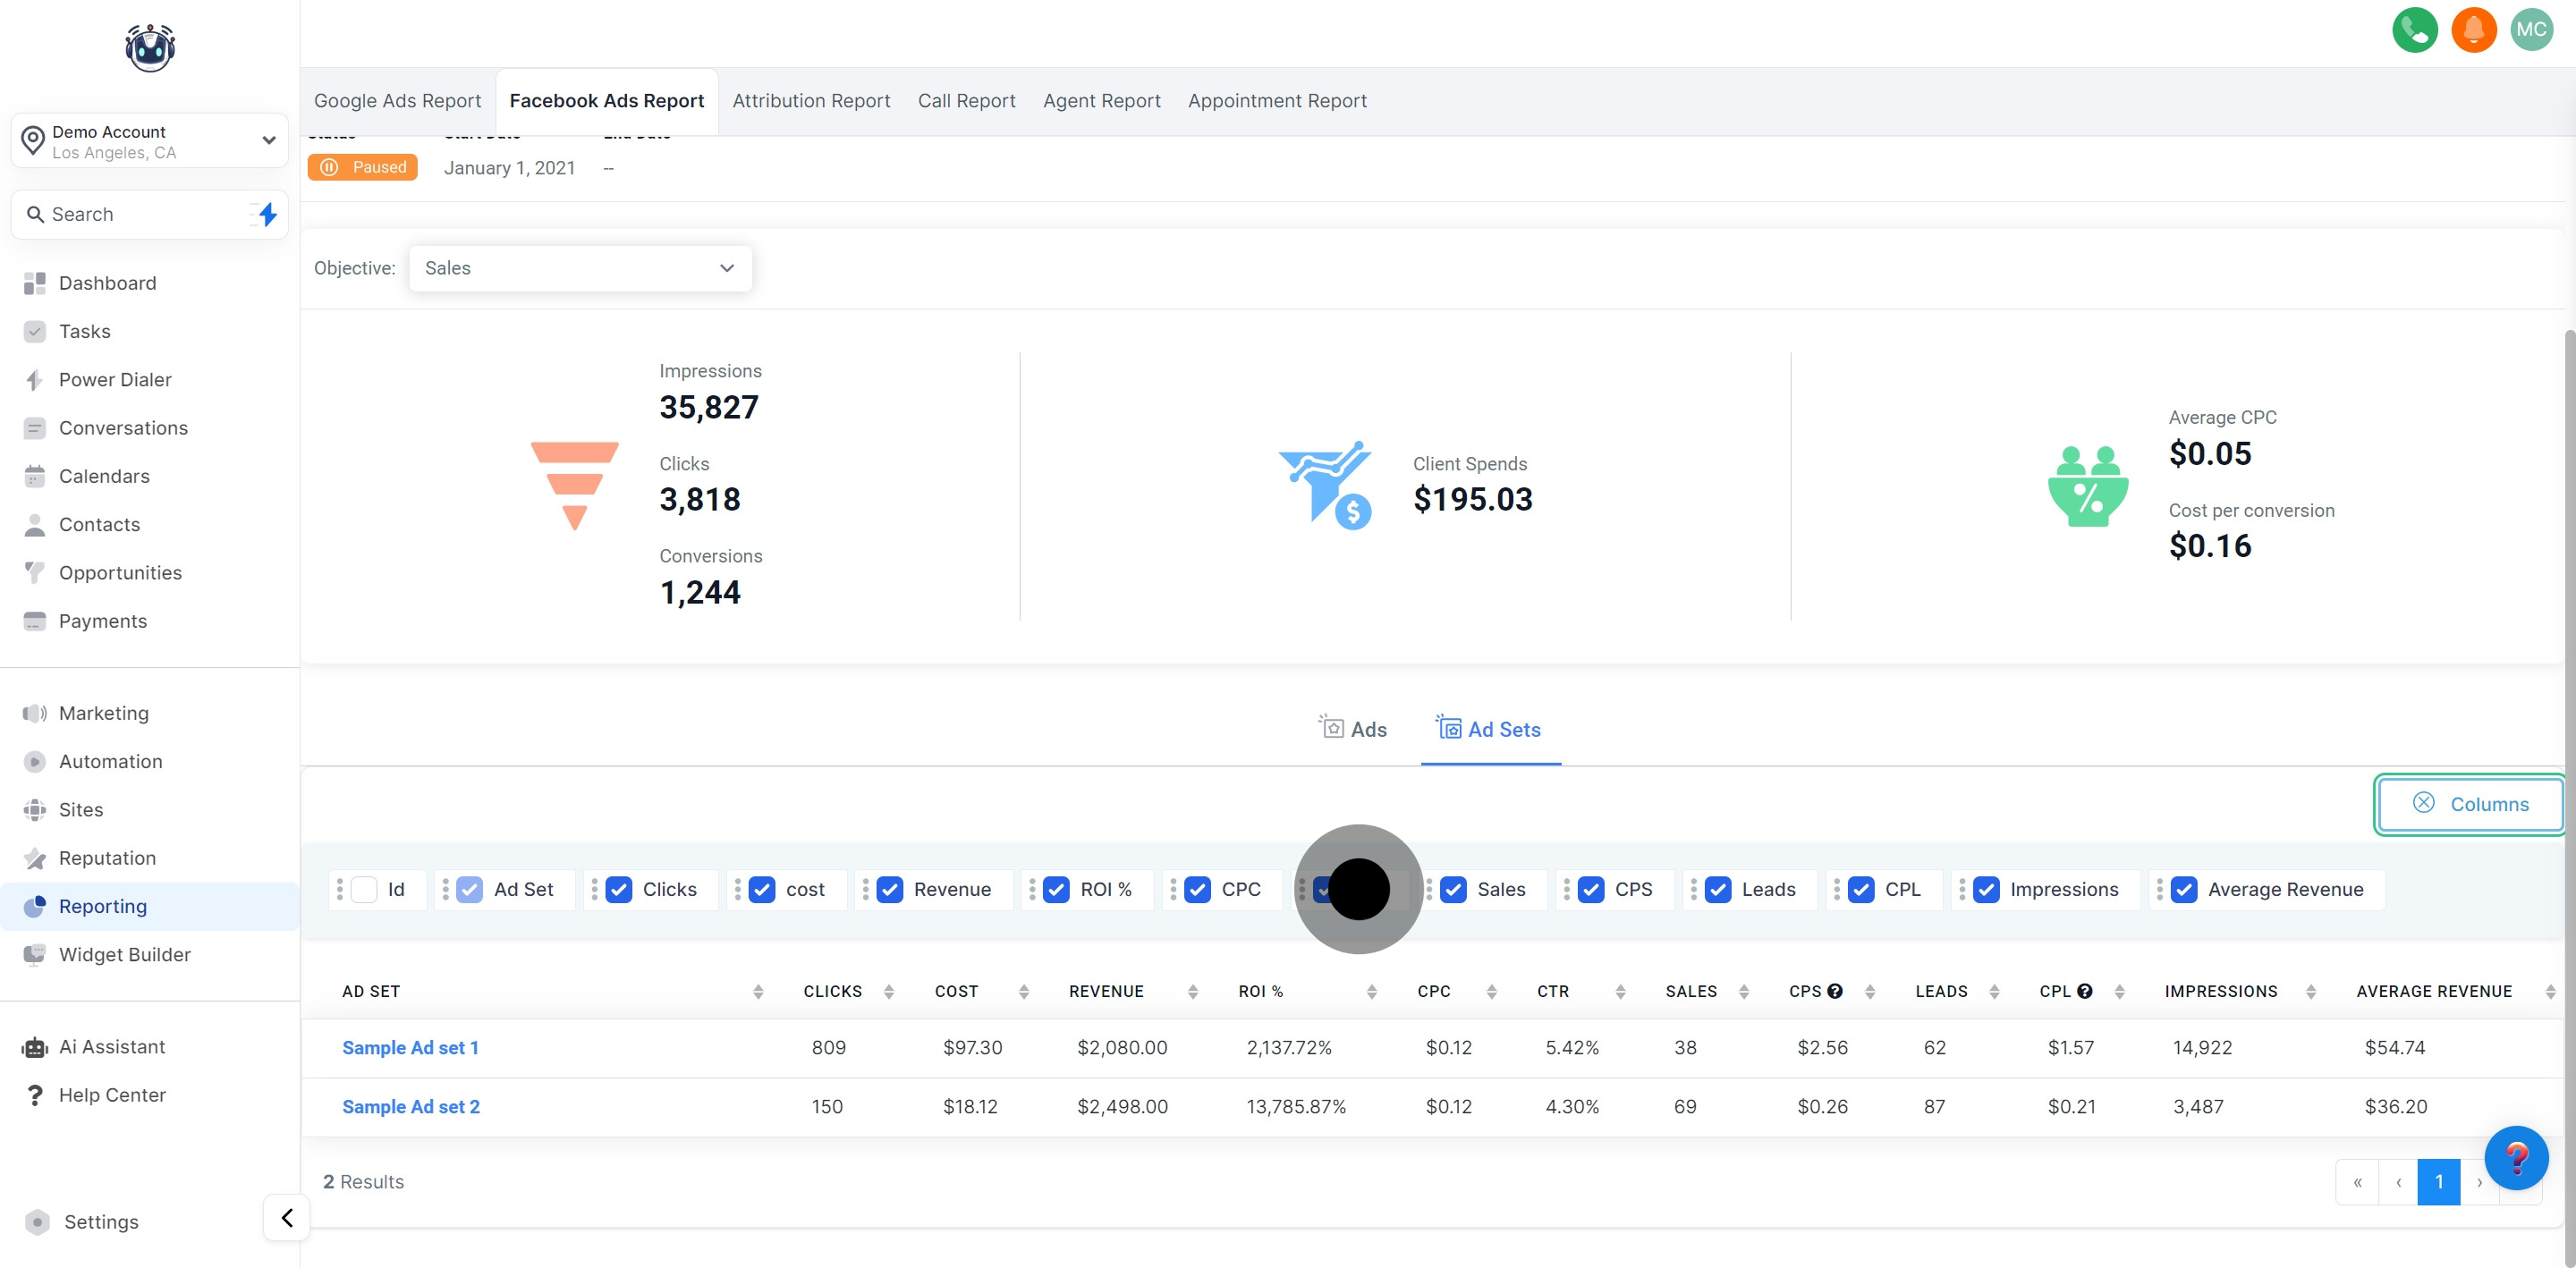
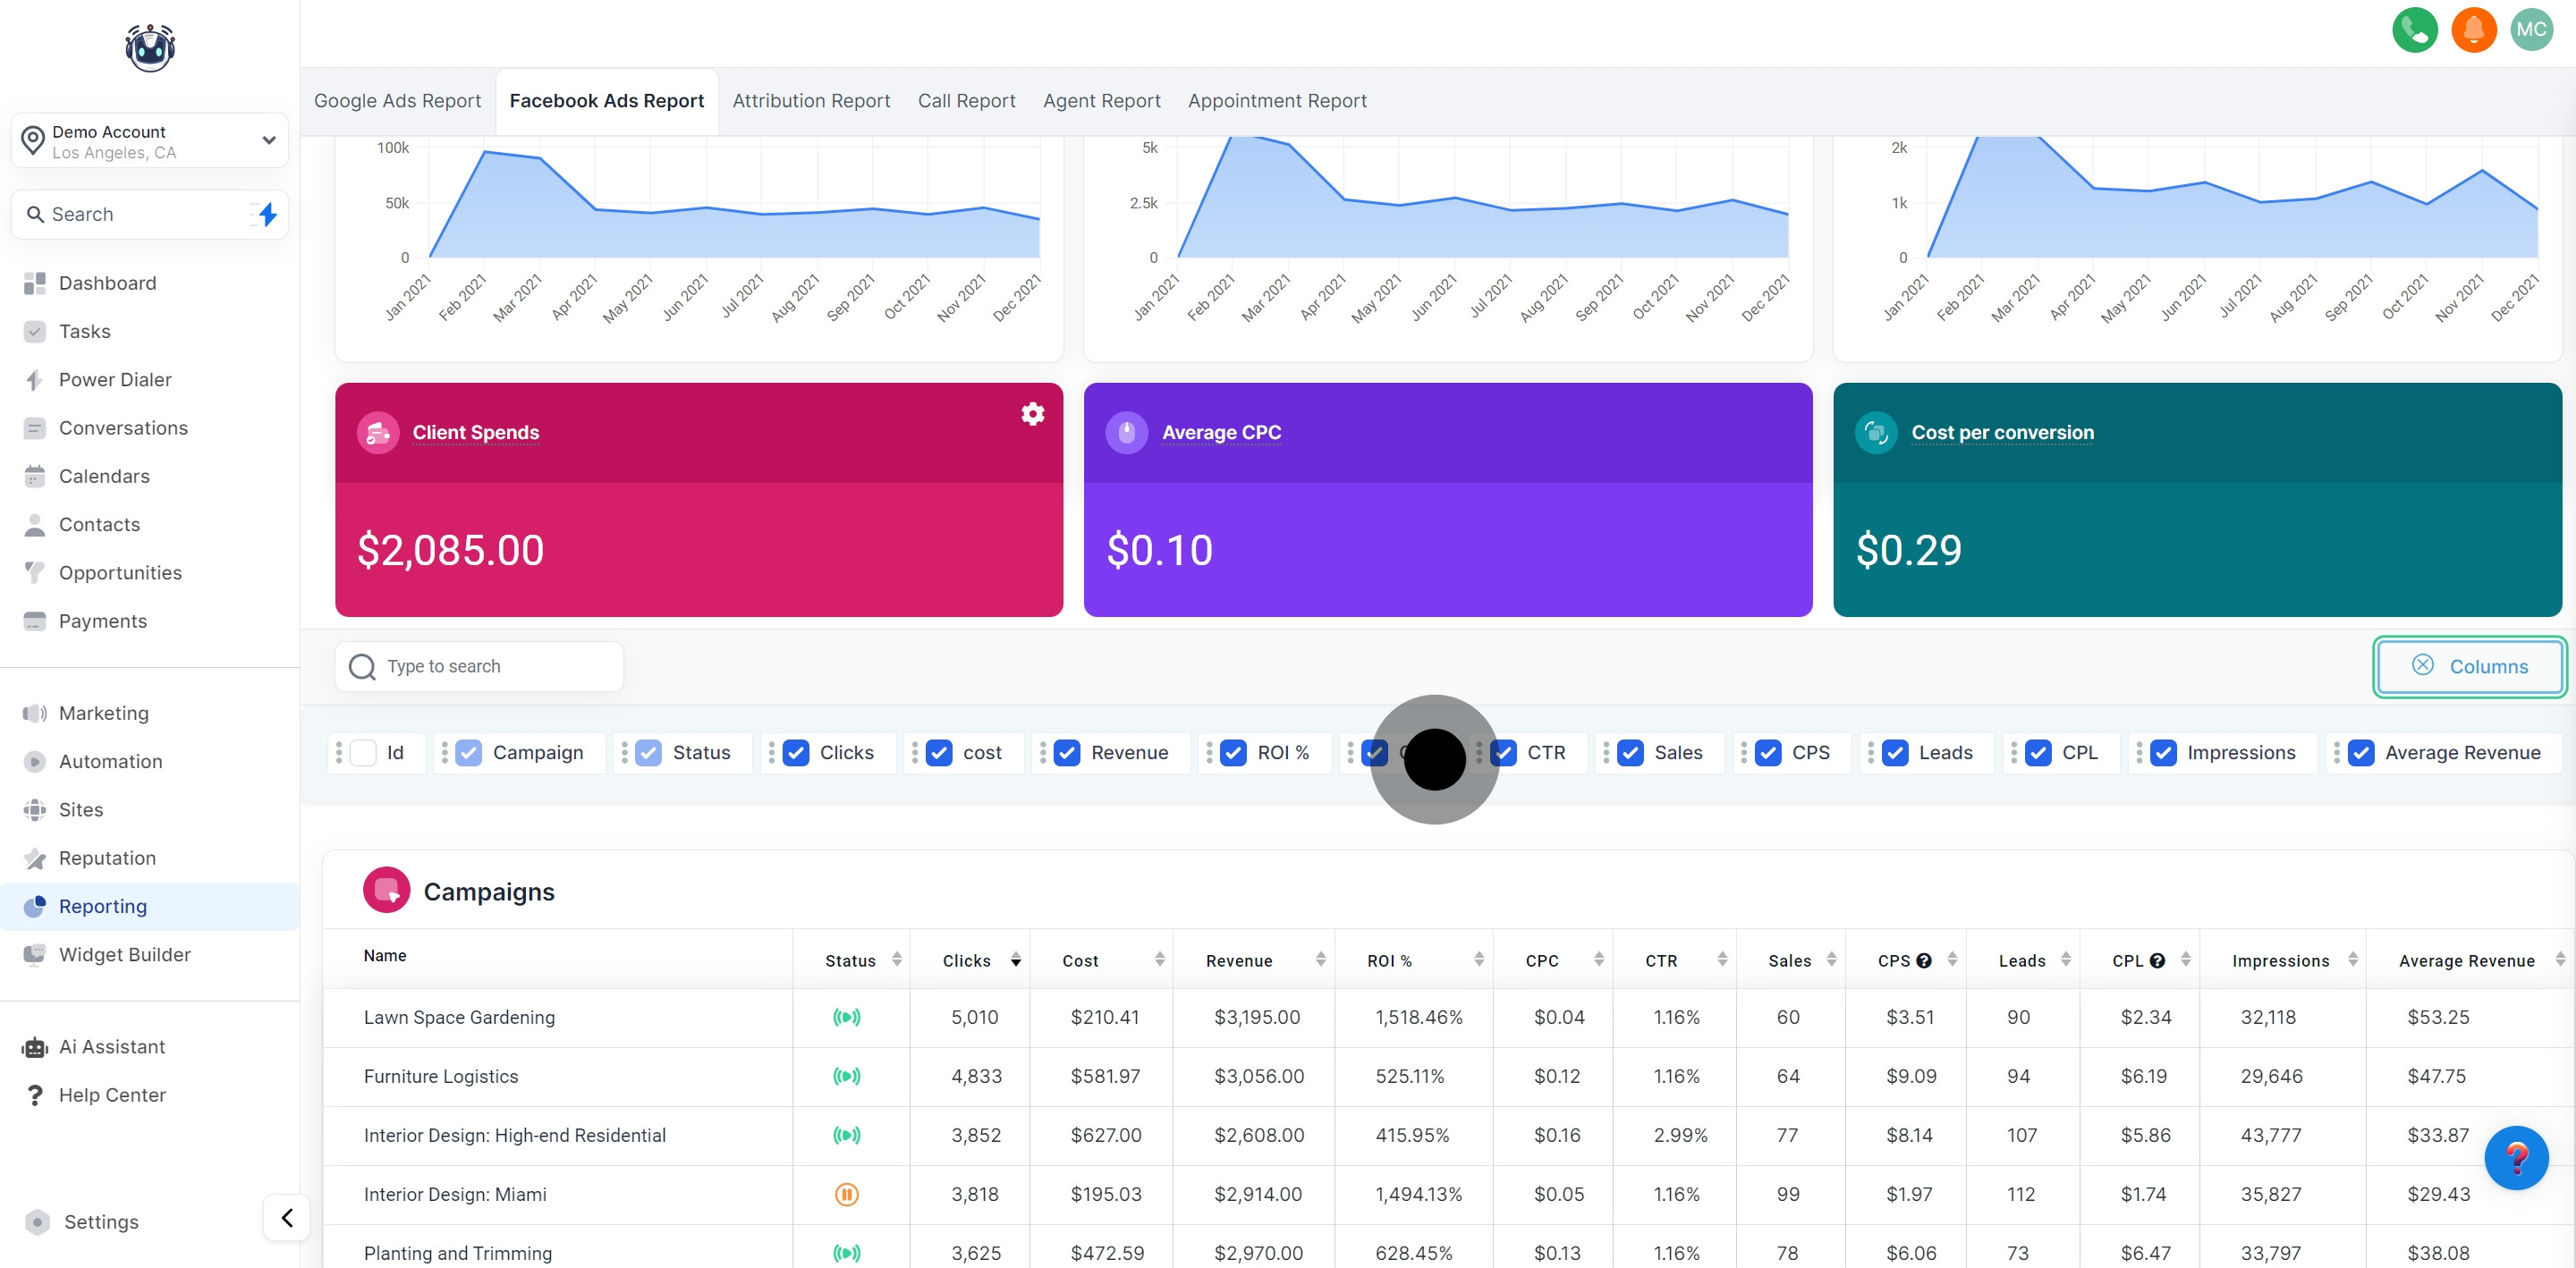
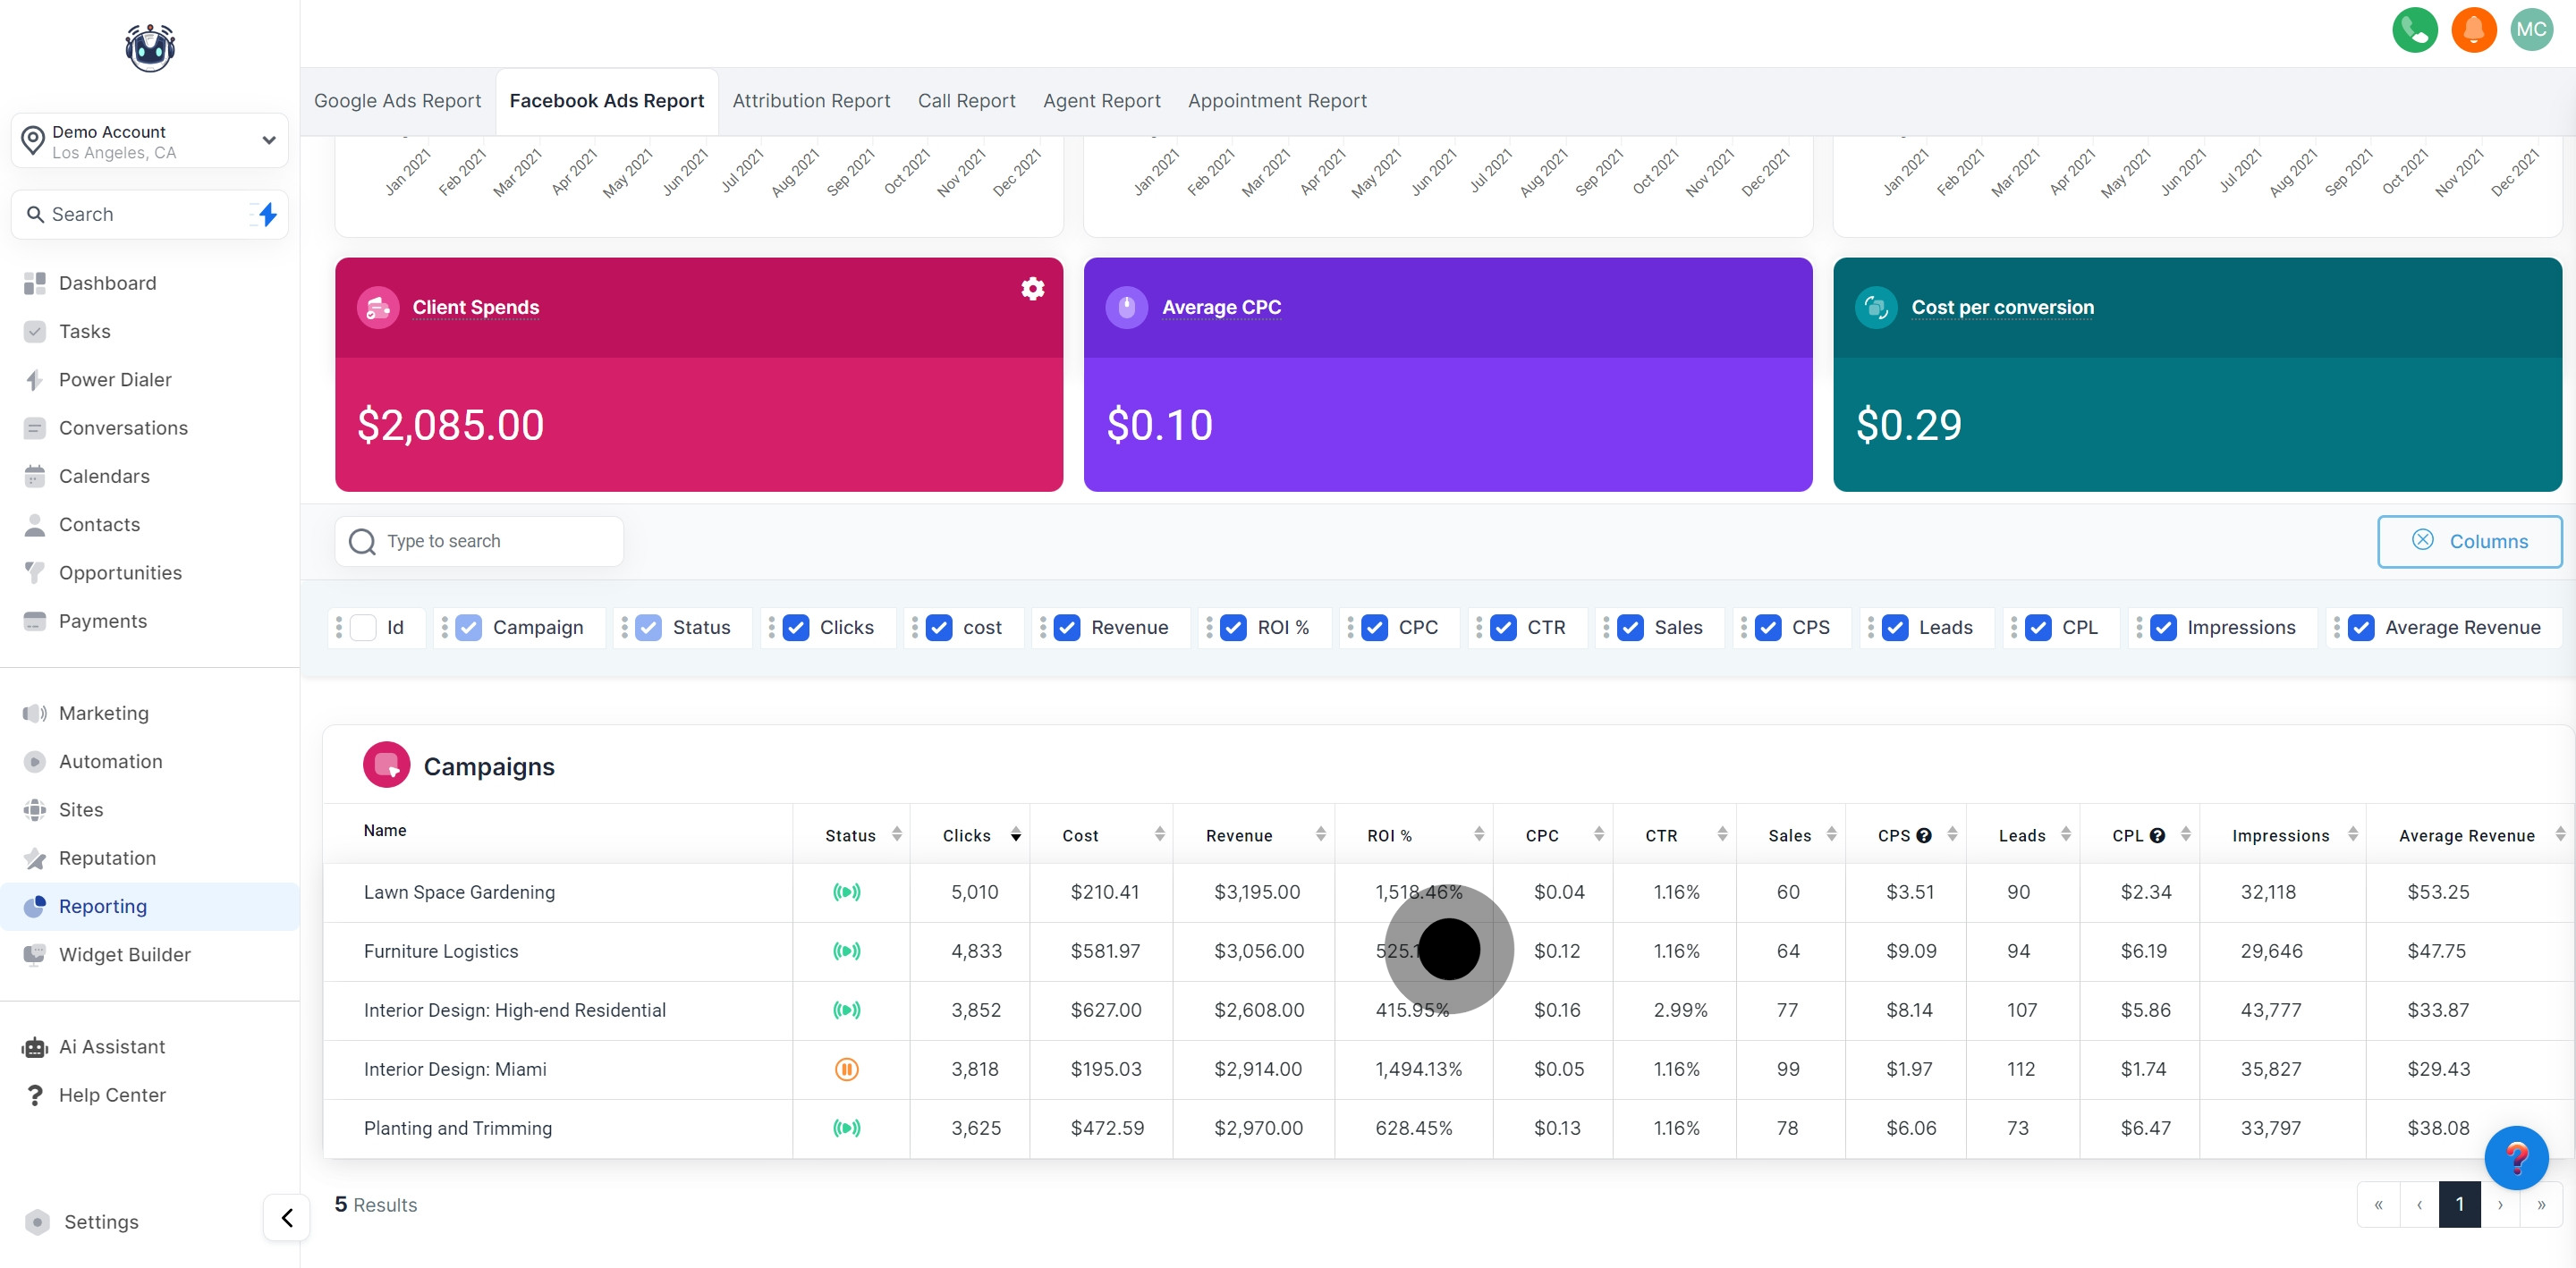
In the Columns section, you have the flexibility to choose the precise data you want to display by toggling the checkboxes. After making your selections, click on the column tab once more to preserve your adjustments.
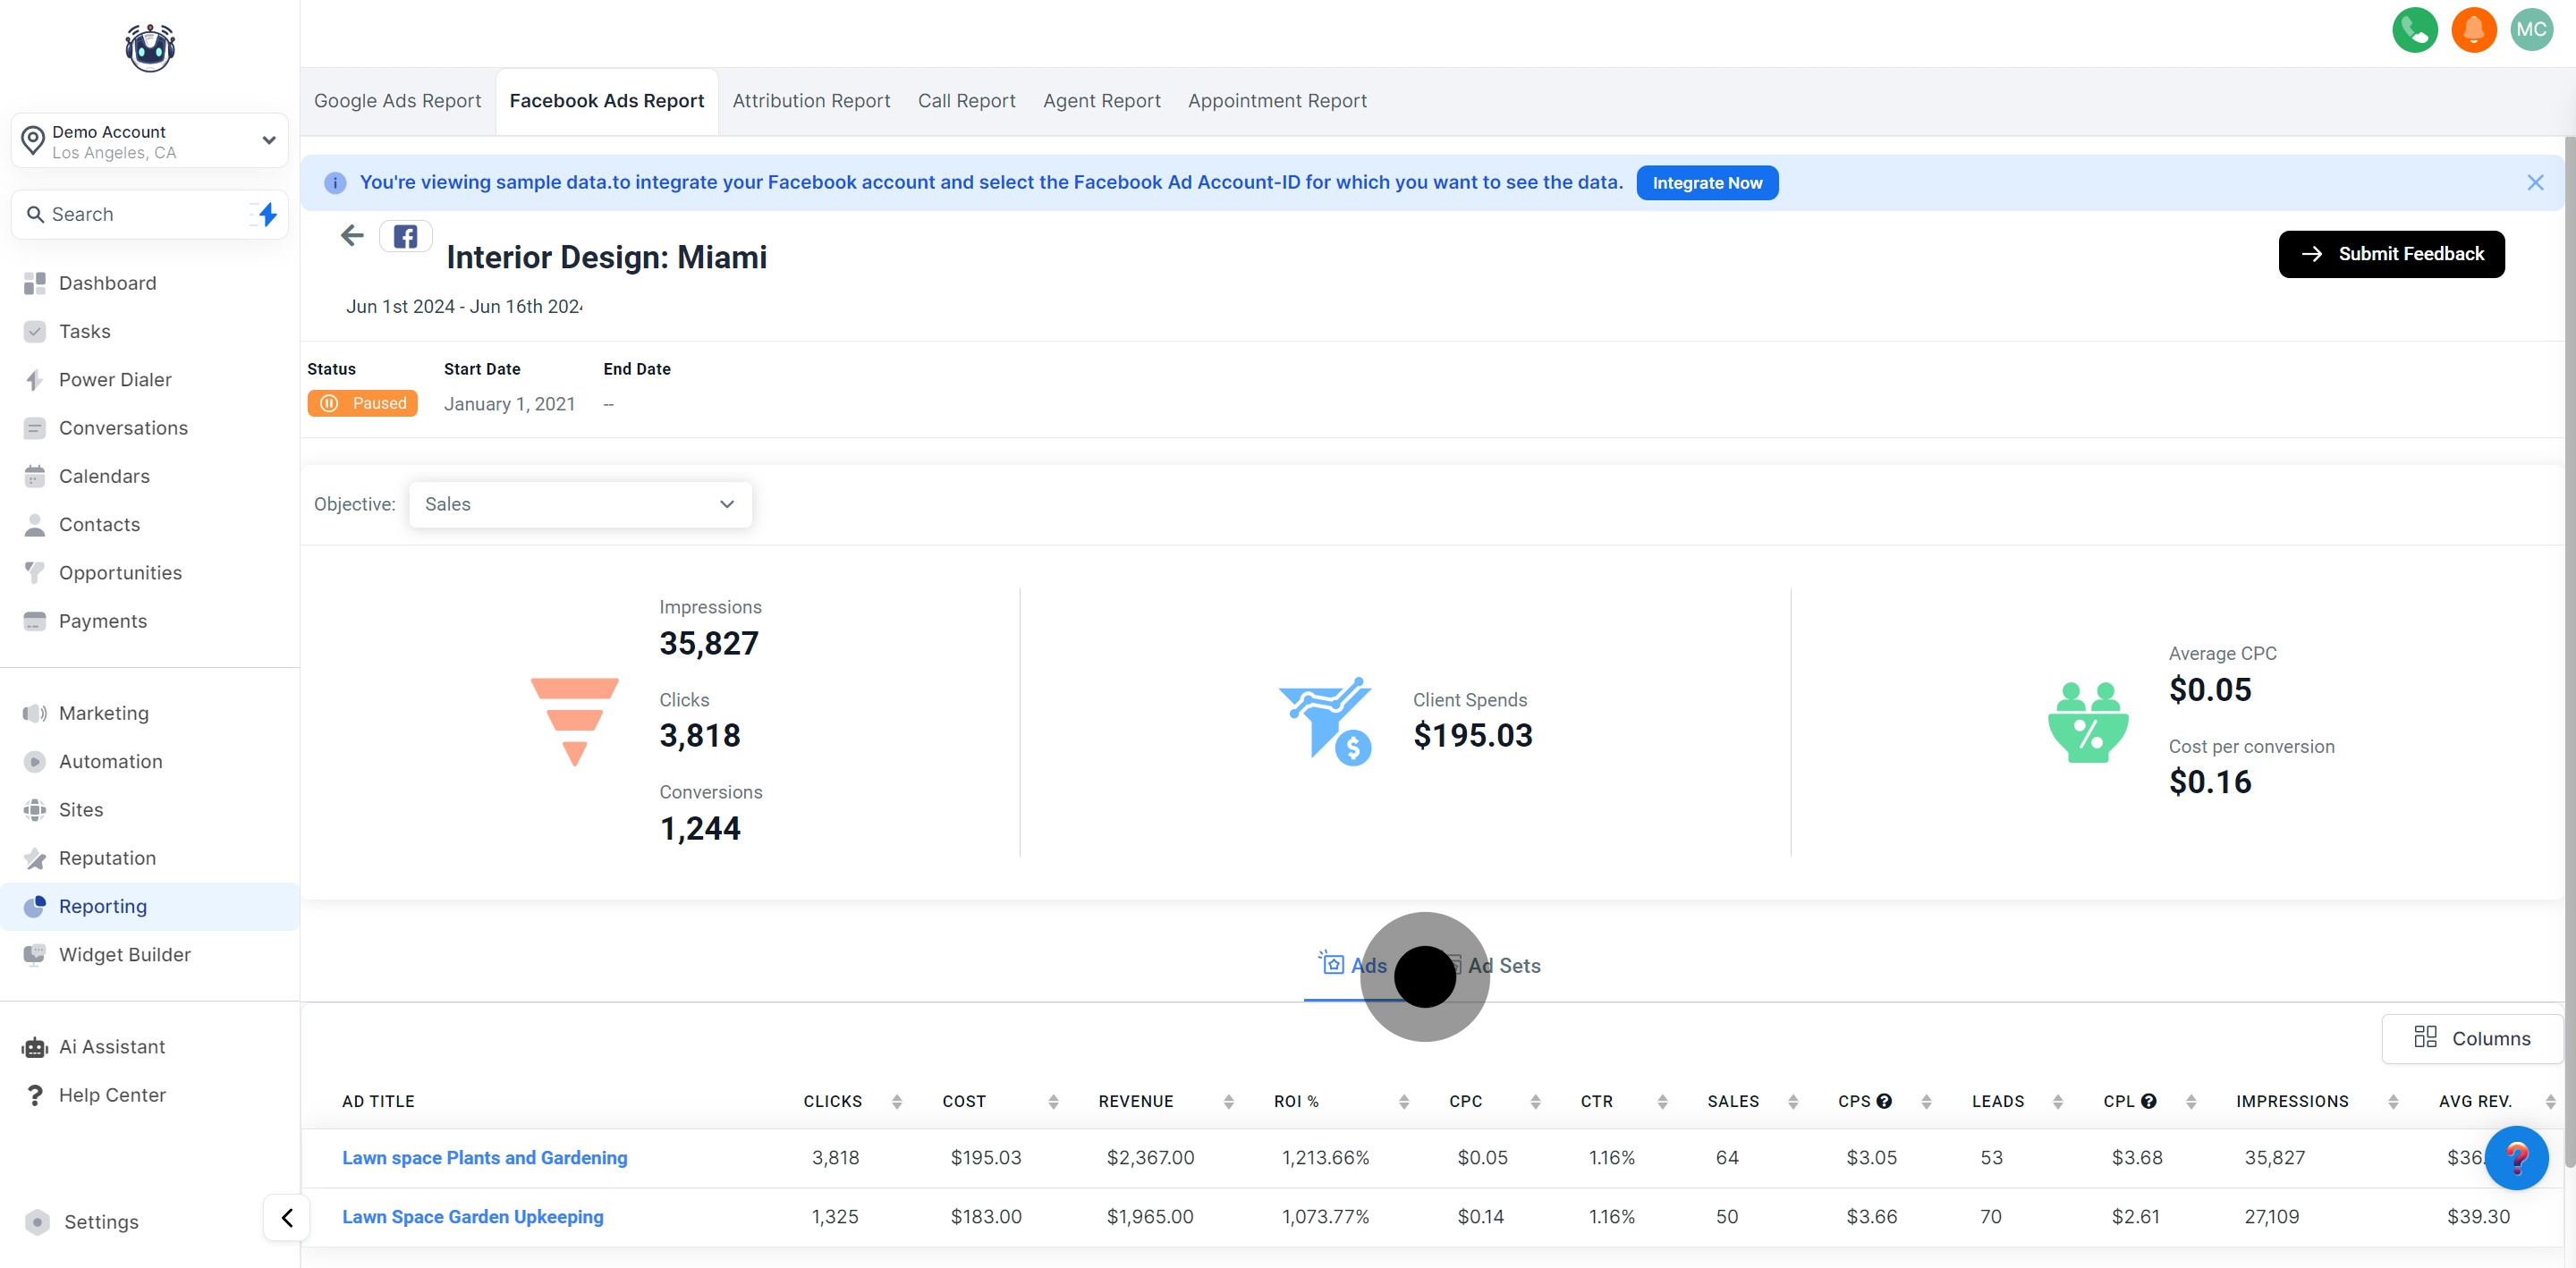
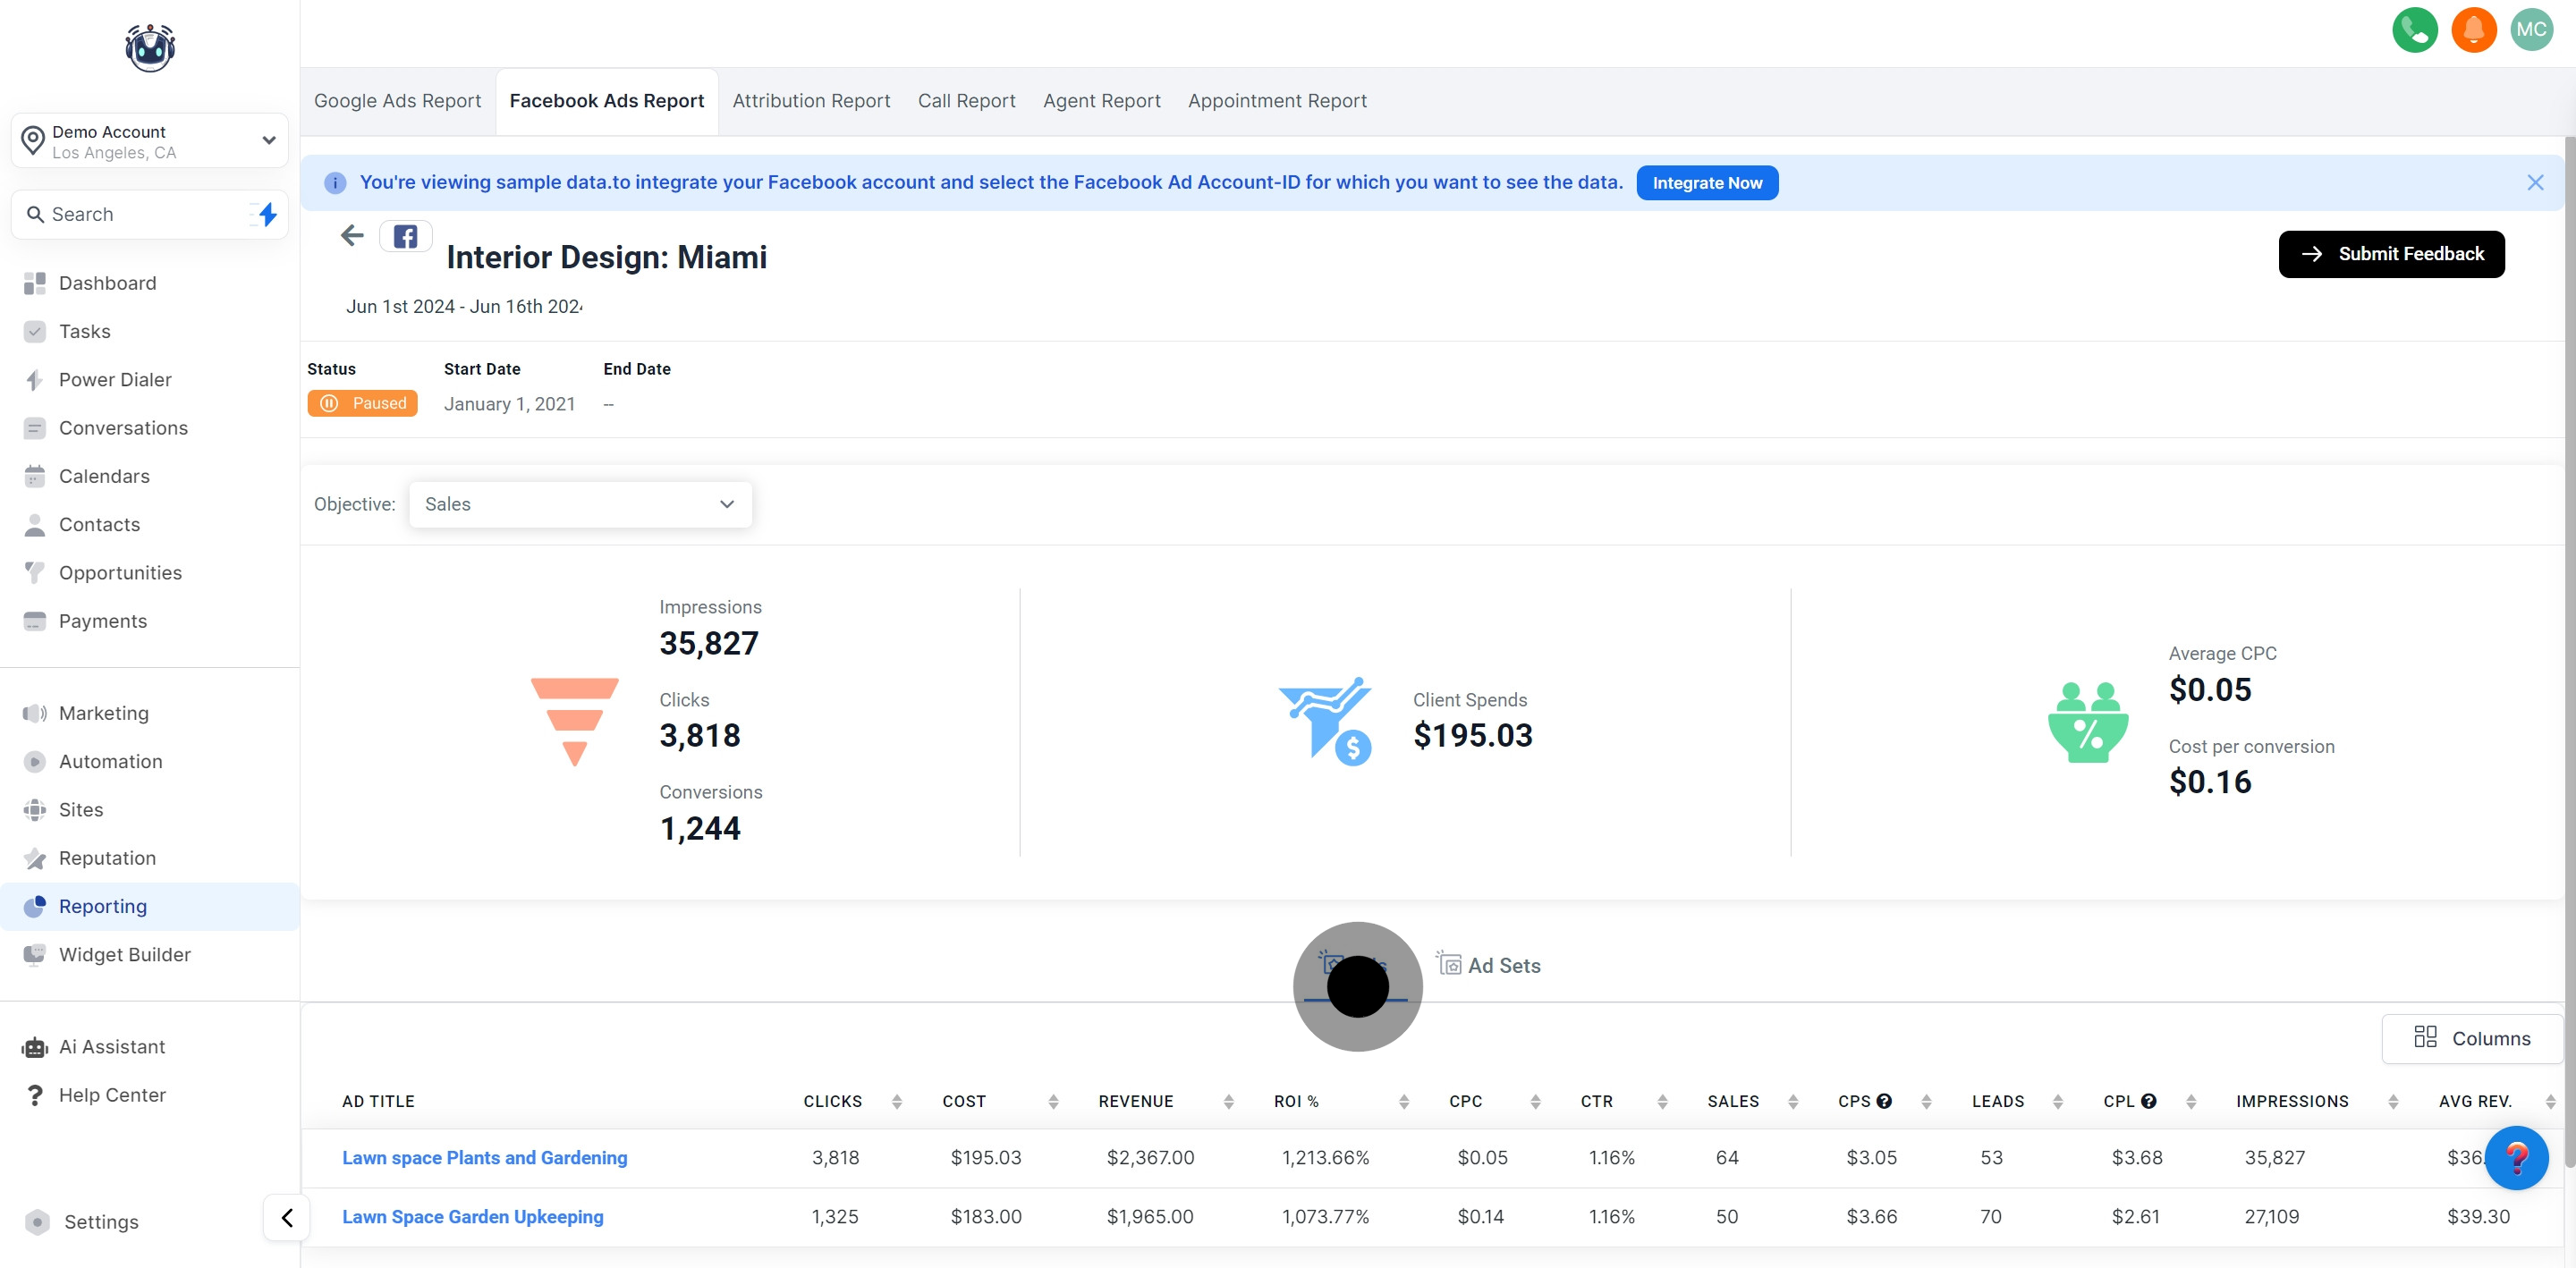
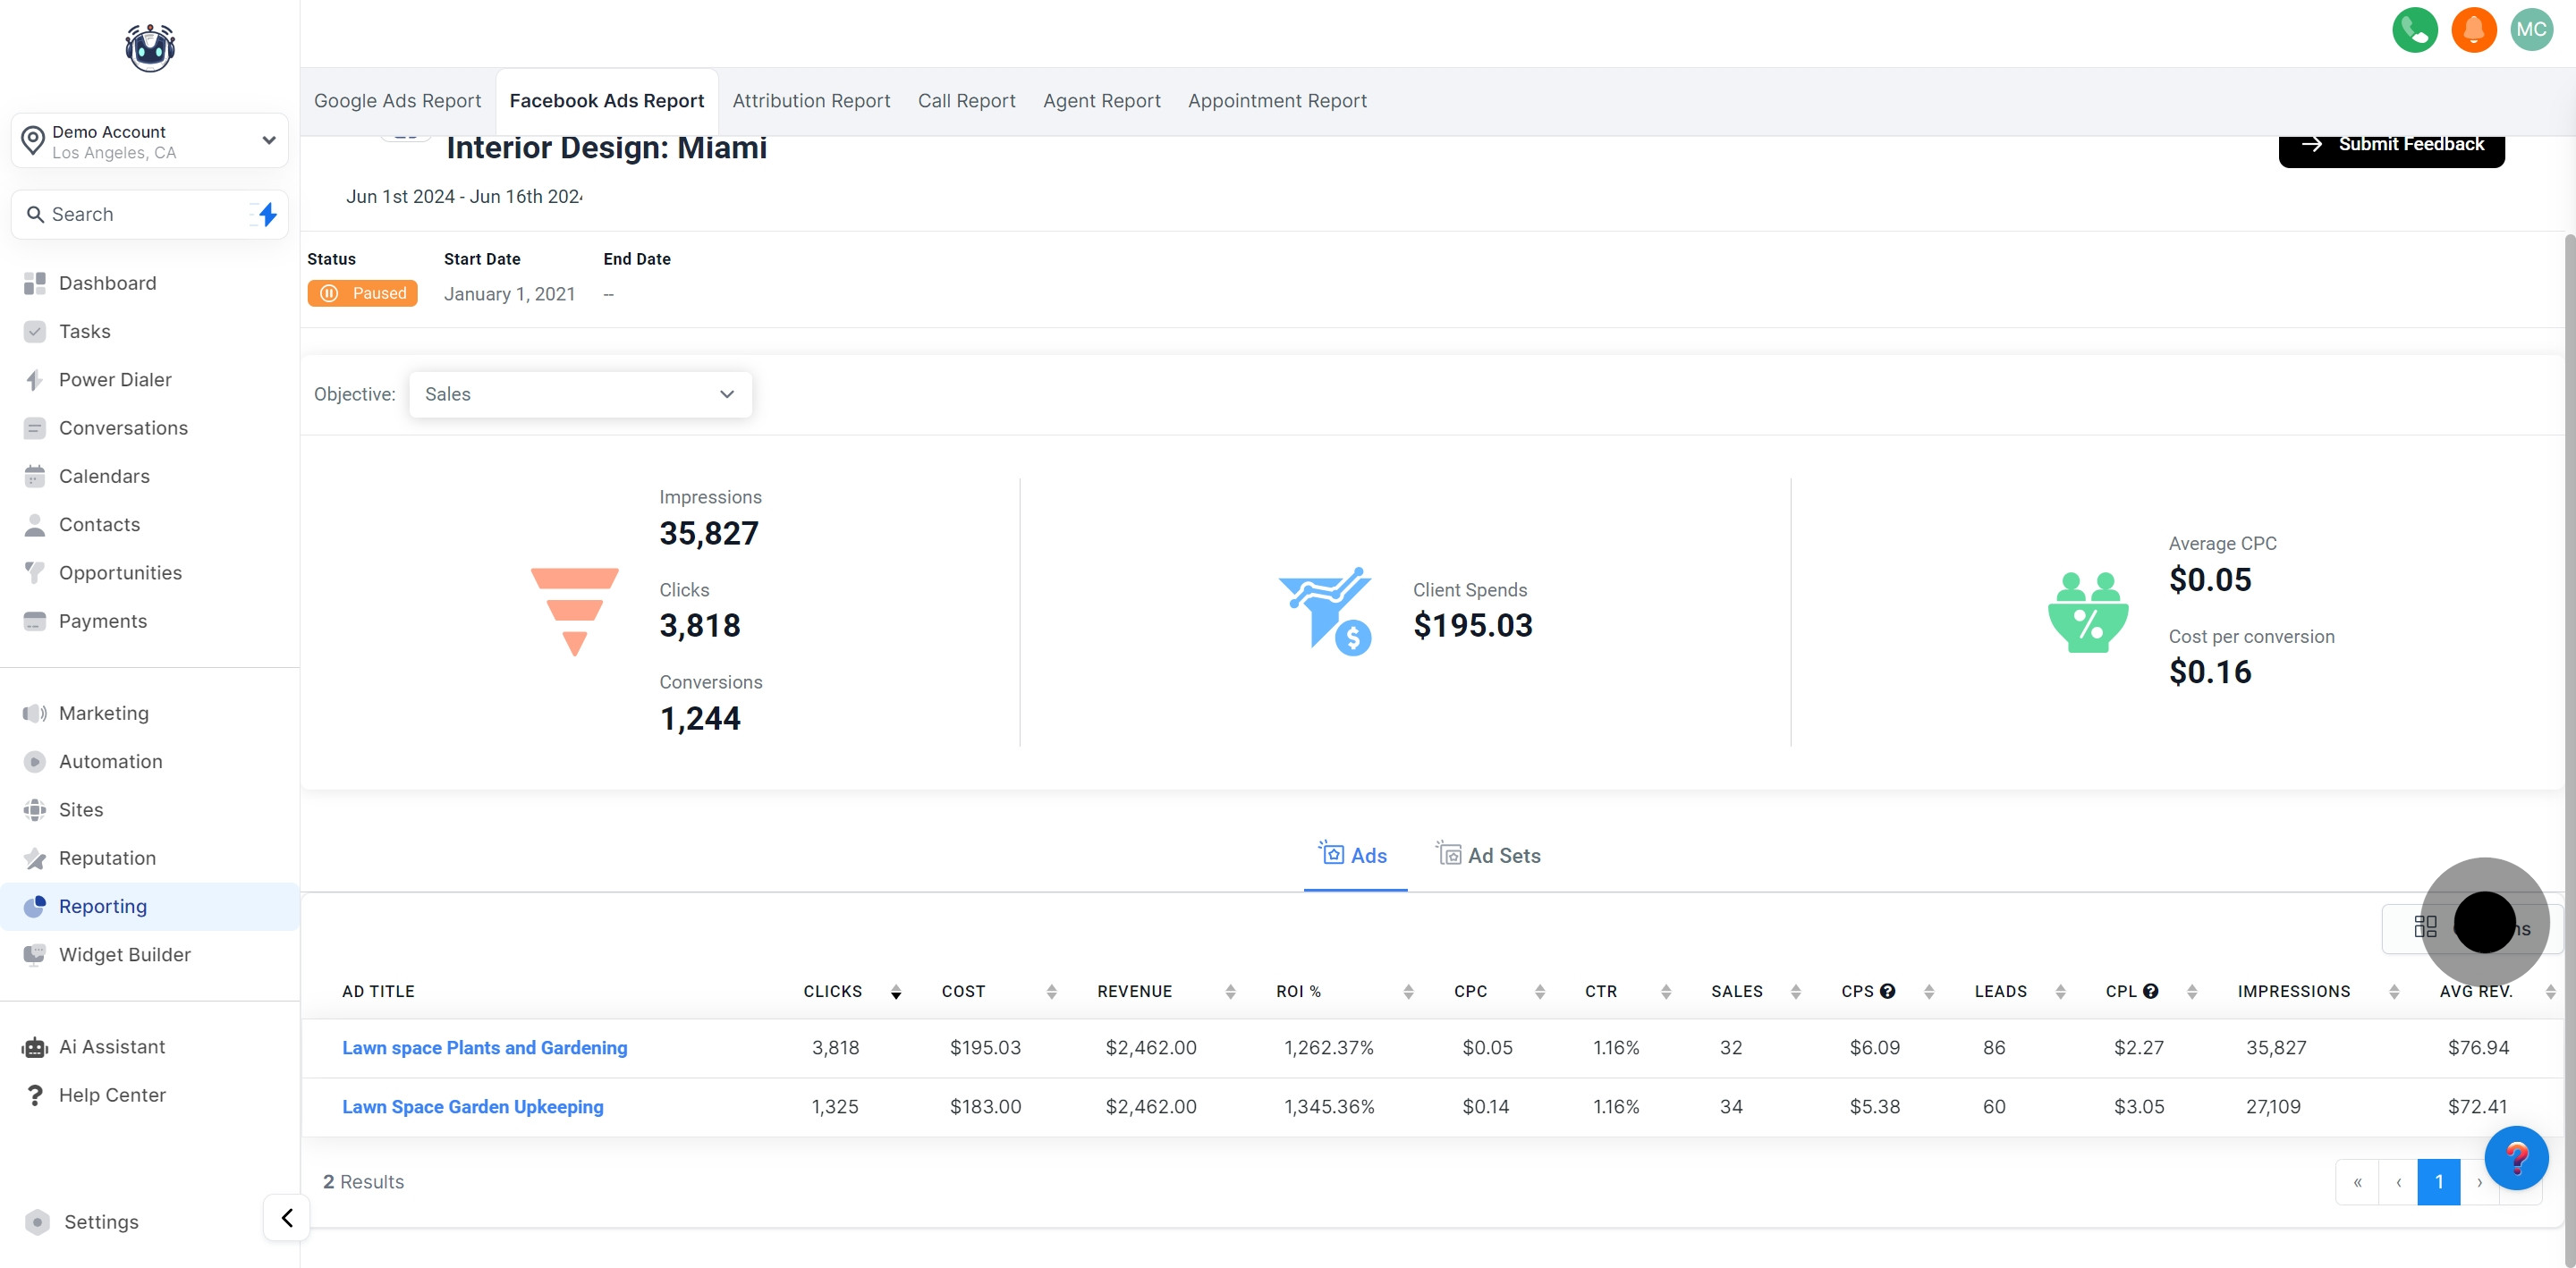
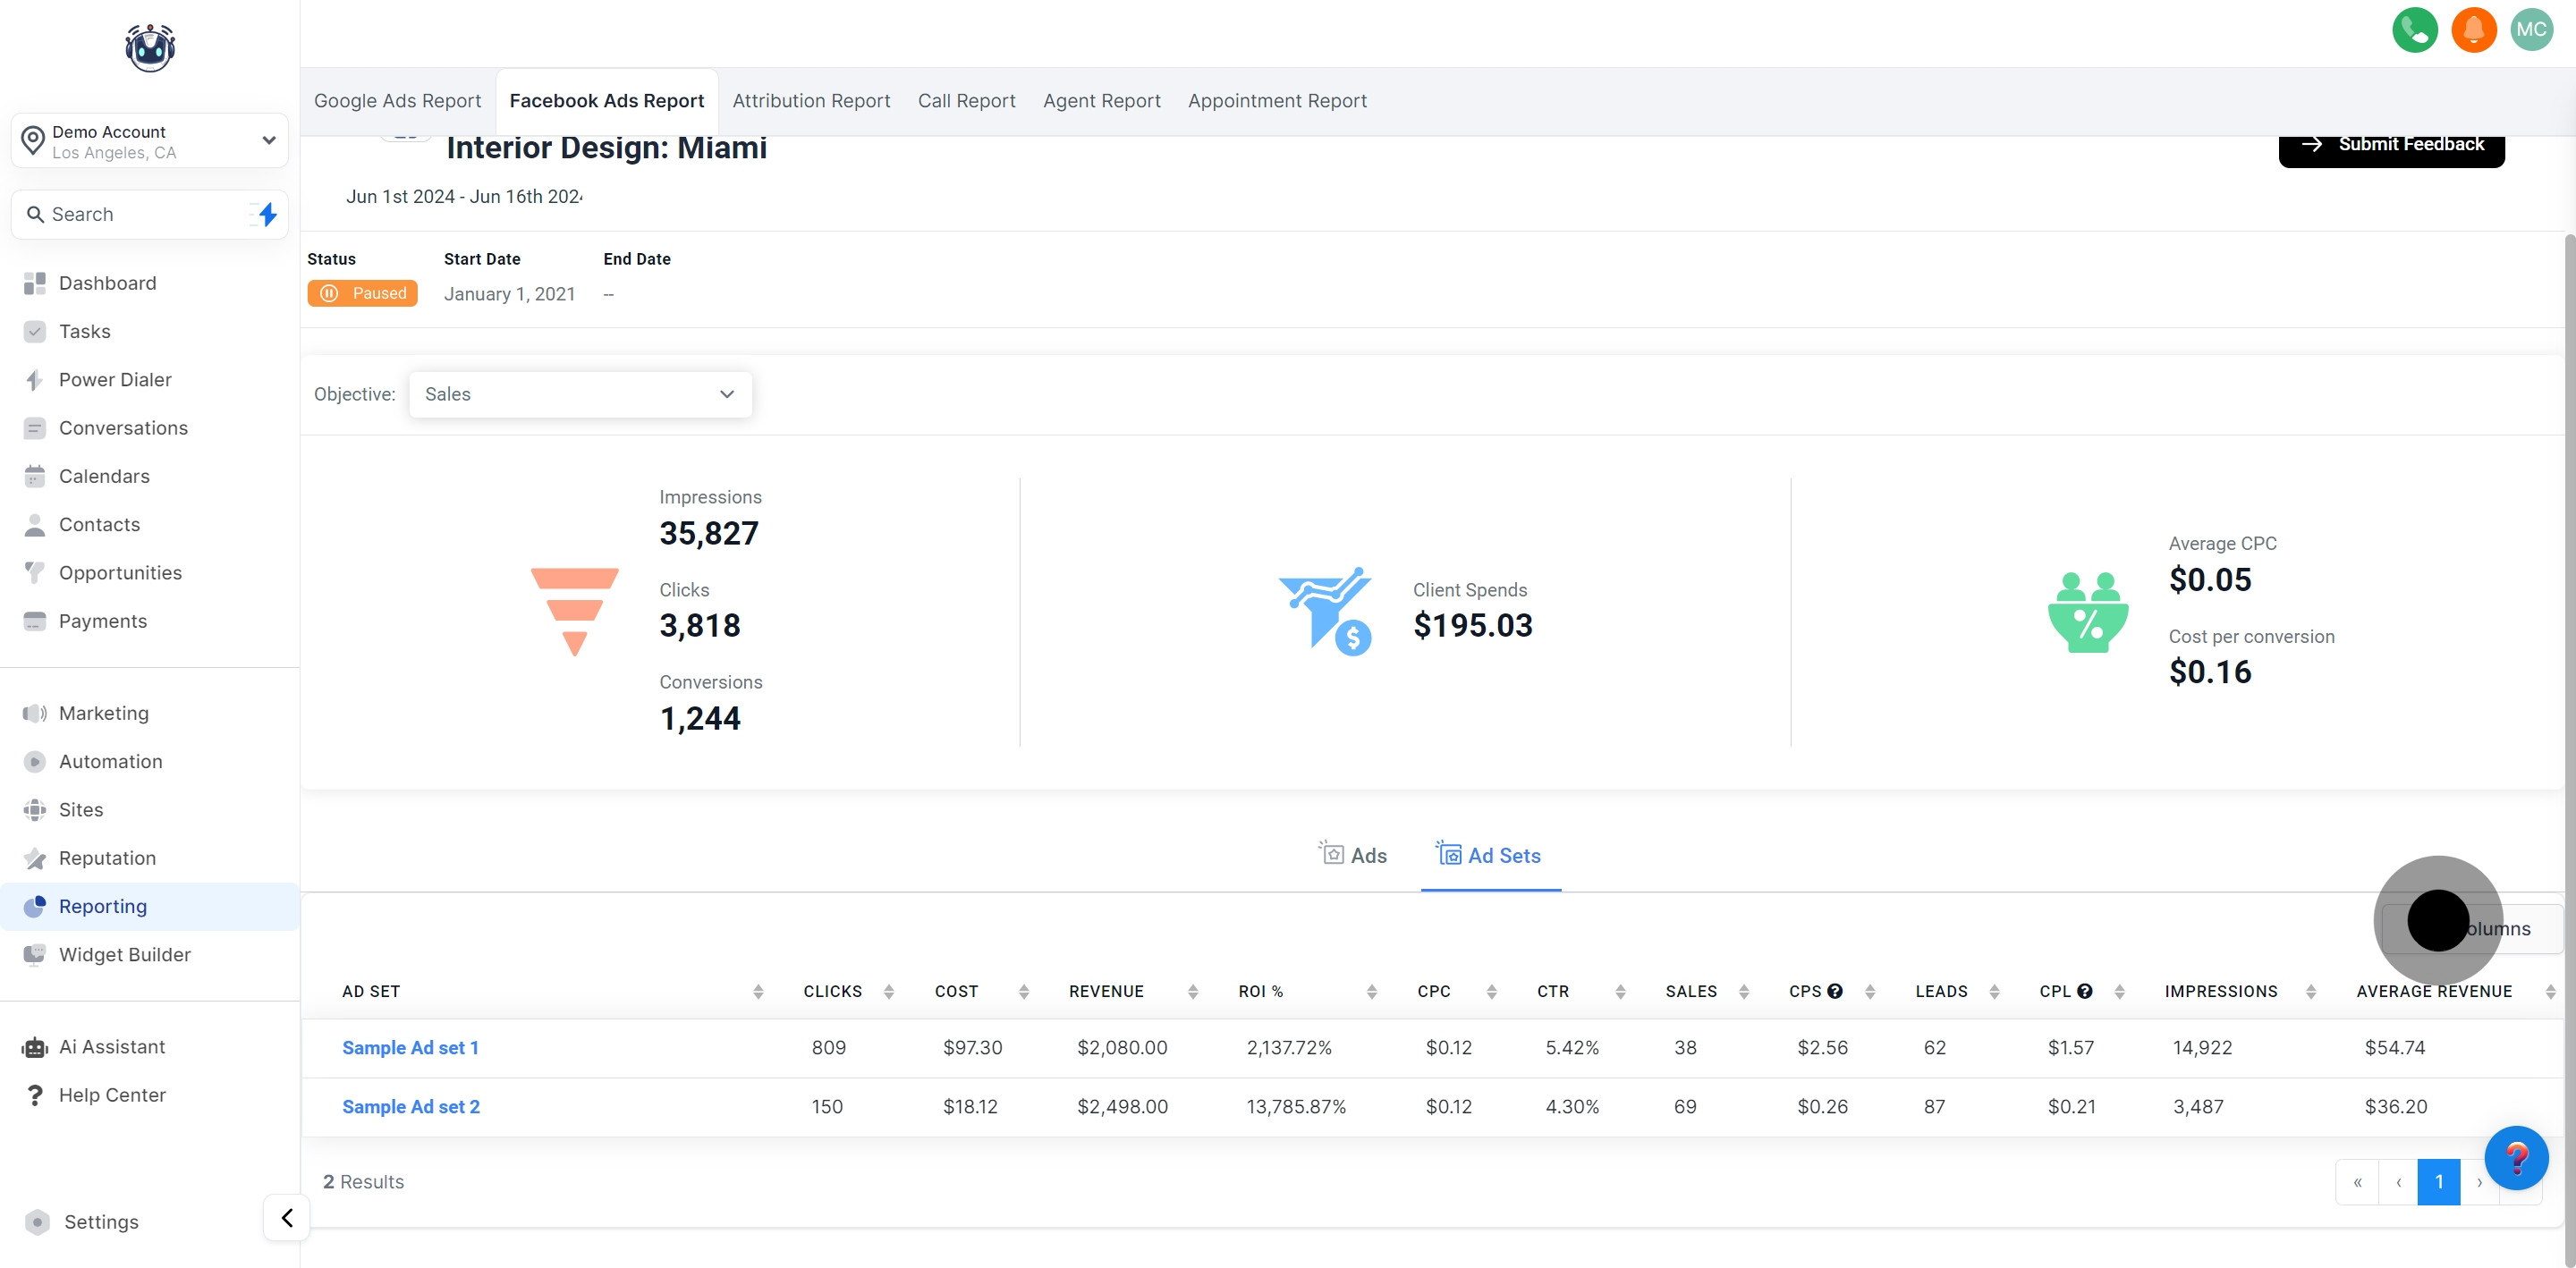
By clicking on any campaign displayed in the reporting section, you'll open this tab where the statistics for the individual campaign you've selected from the list will be visible.
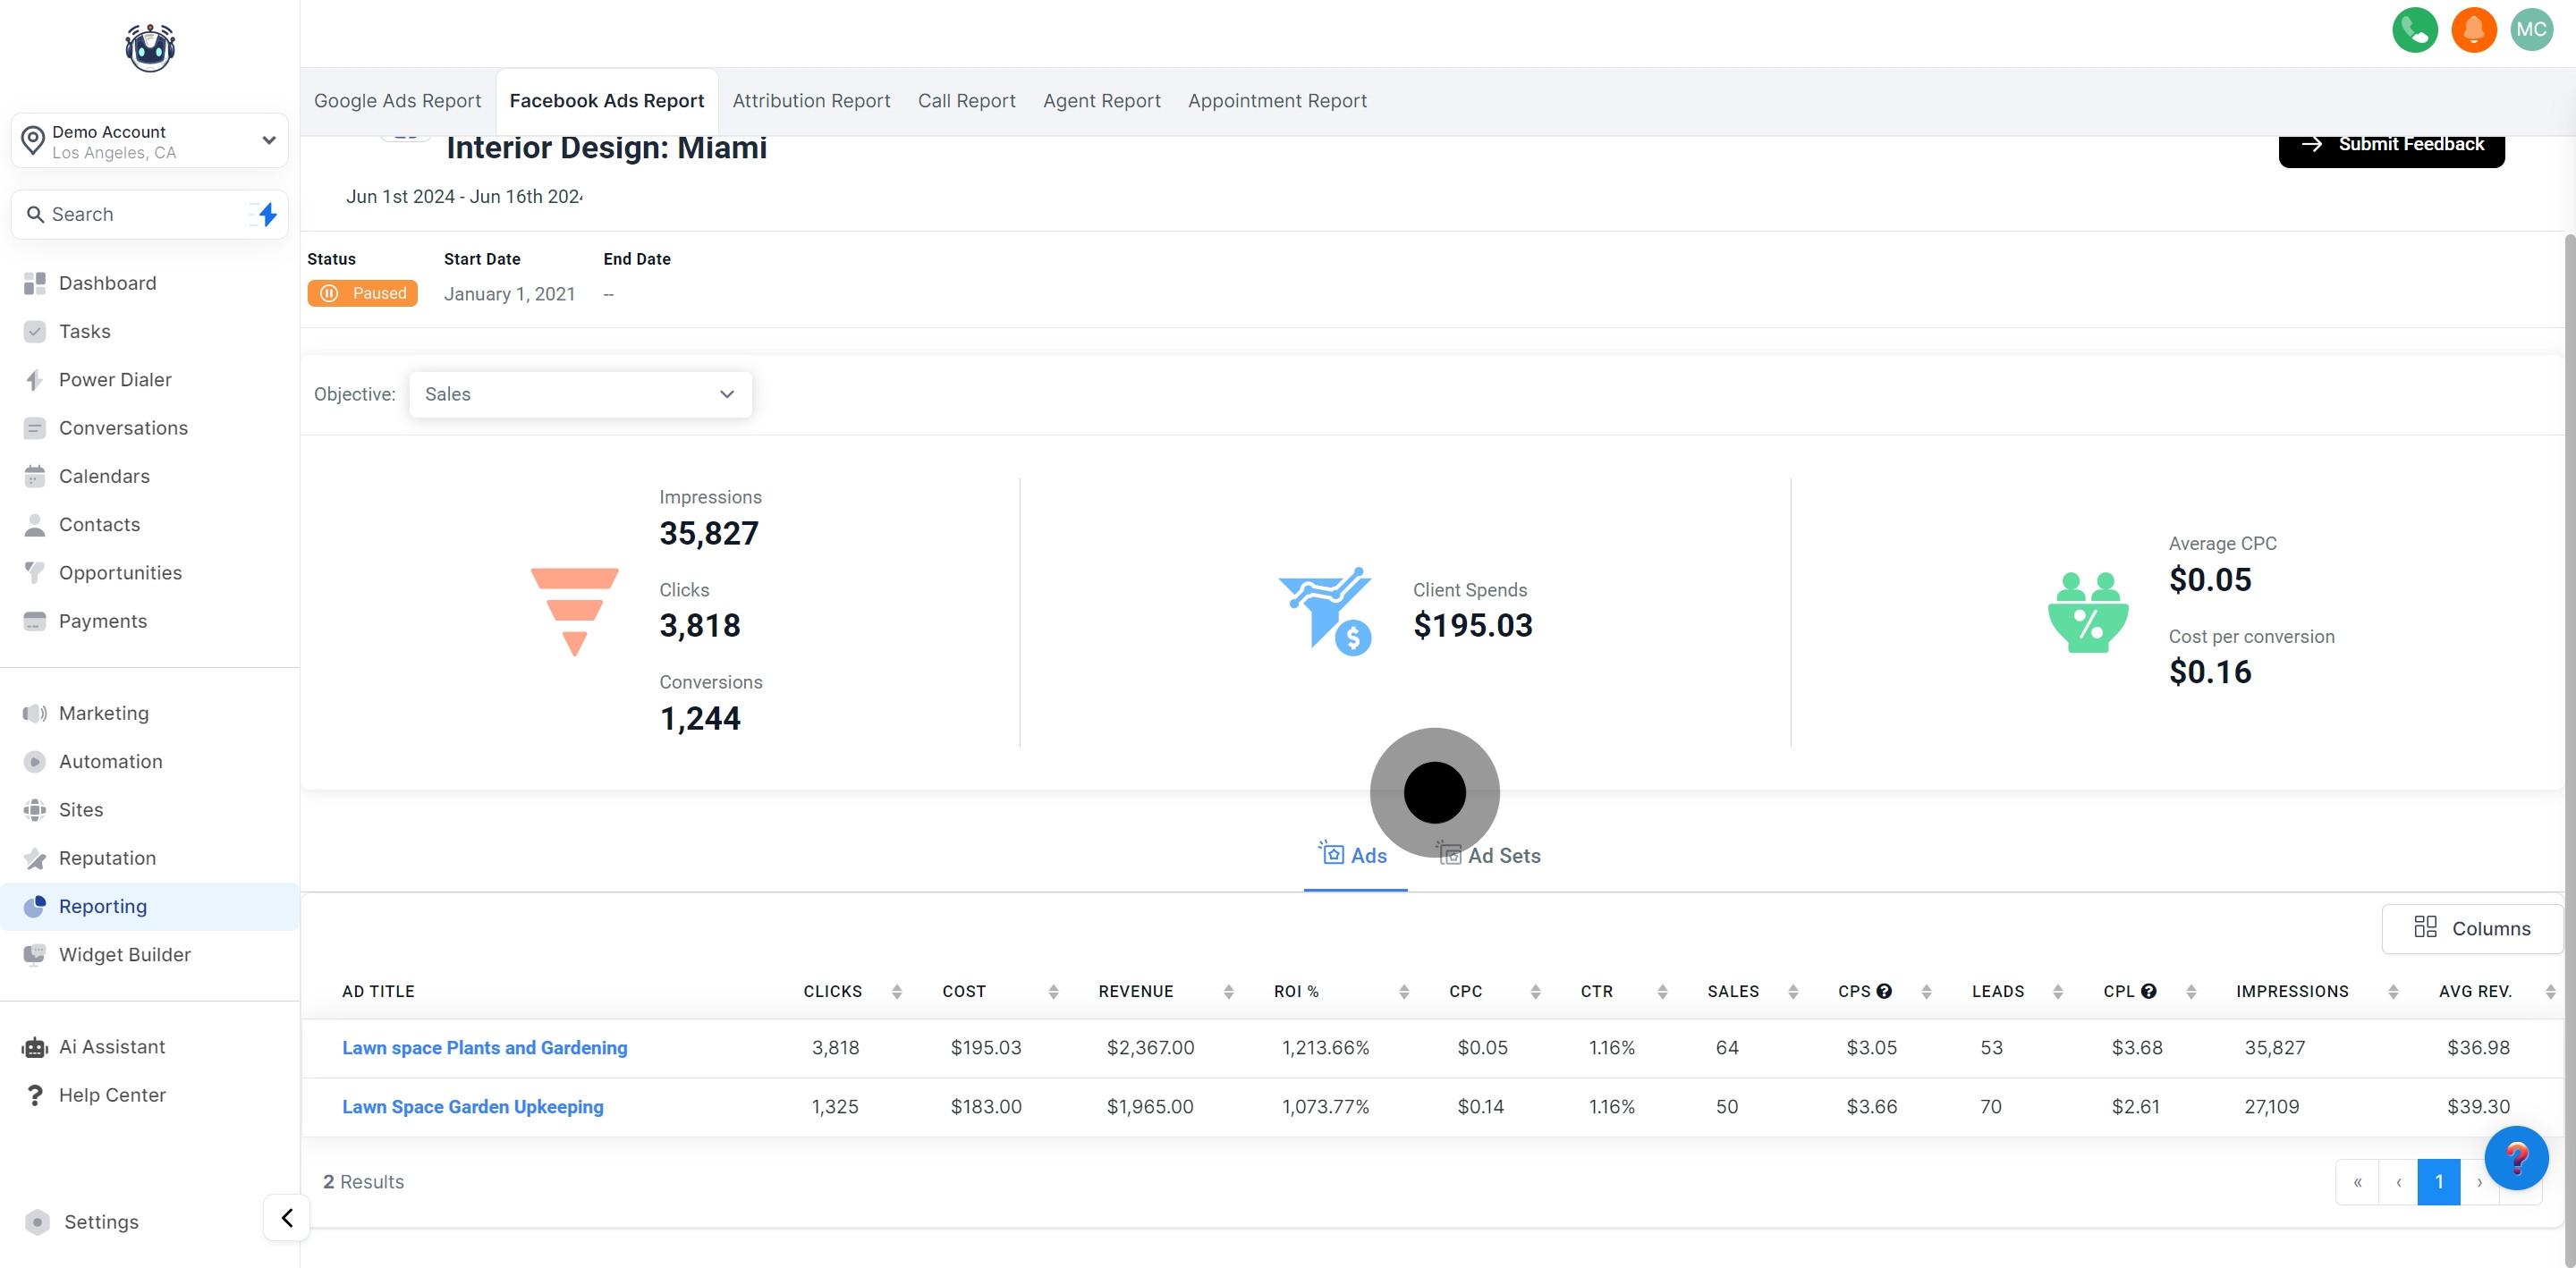
Displays the name of the chosen Facebook ad campaign.
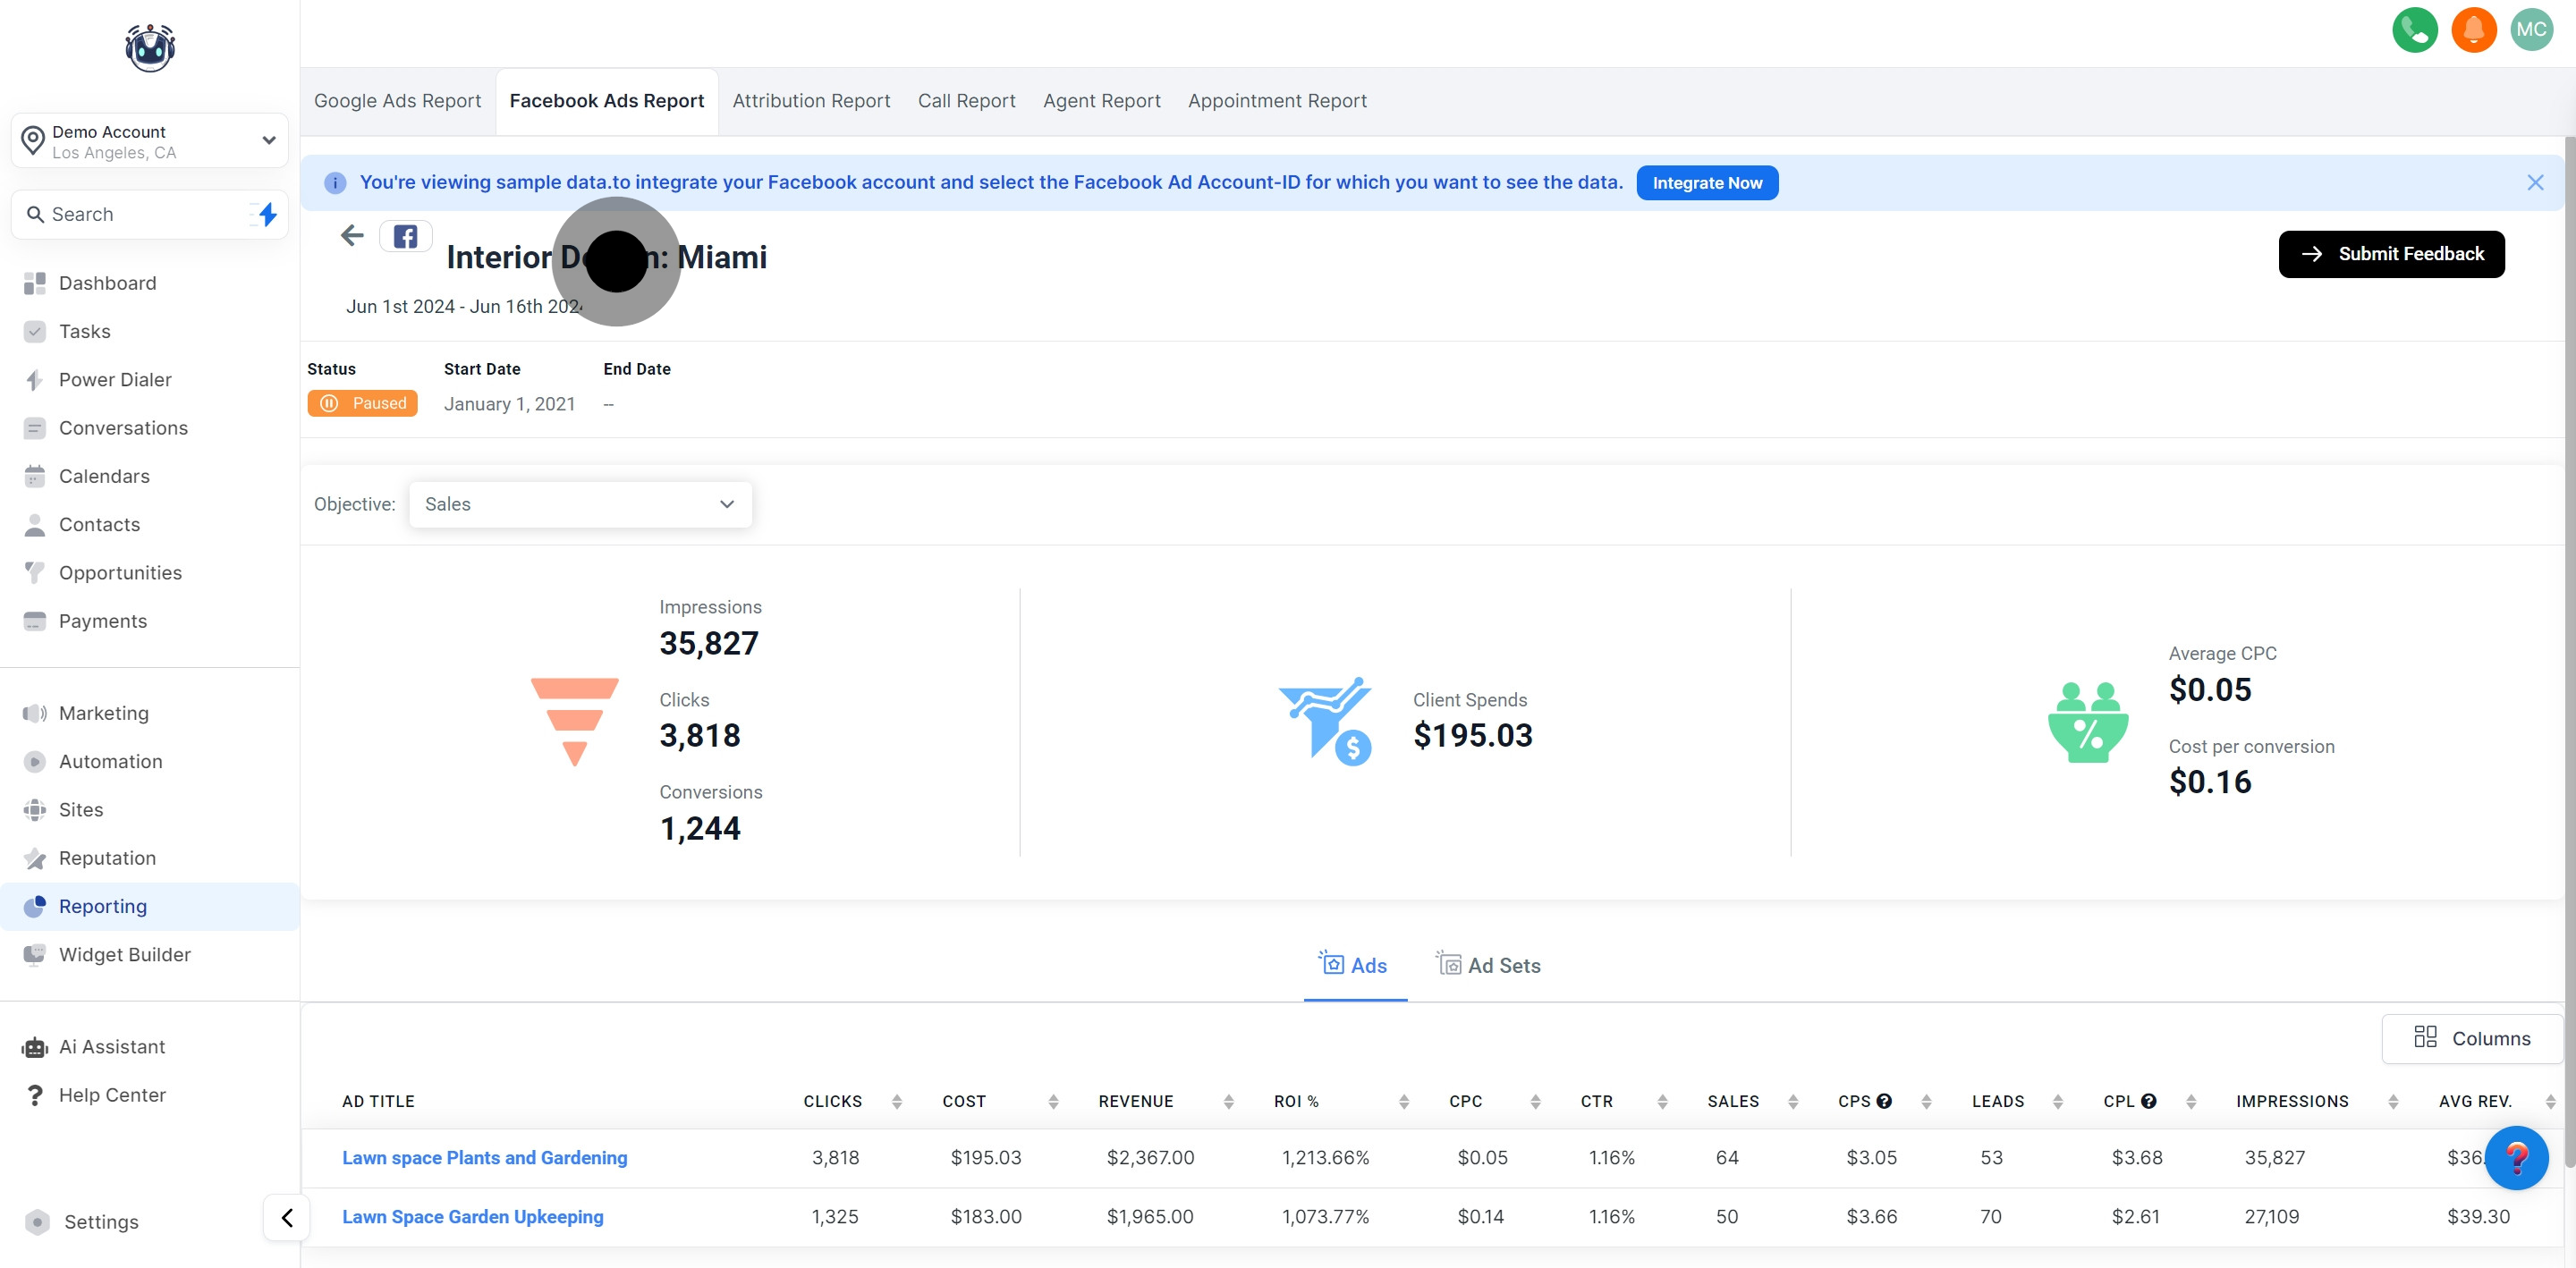
Indicates whether the selected Facebook ad campaign is currently active or paused.
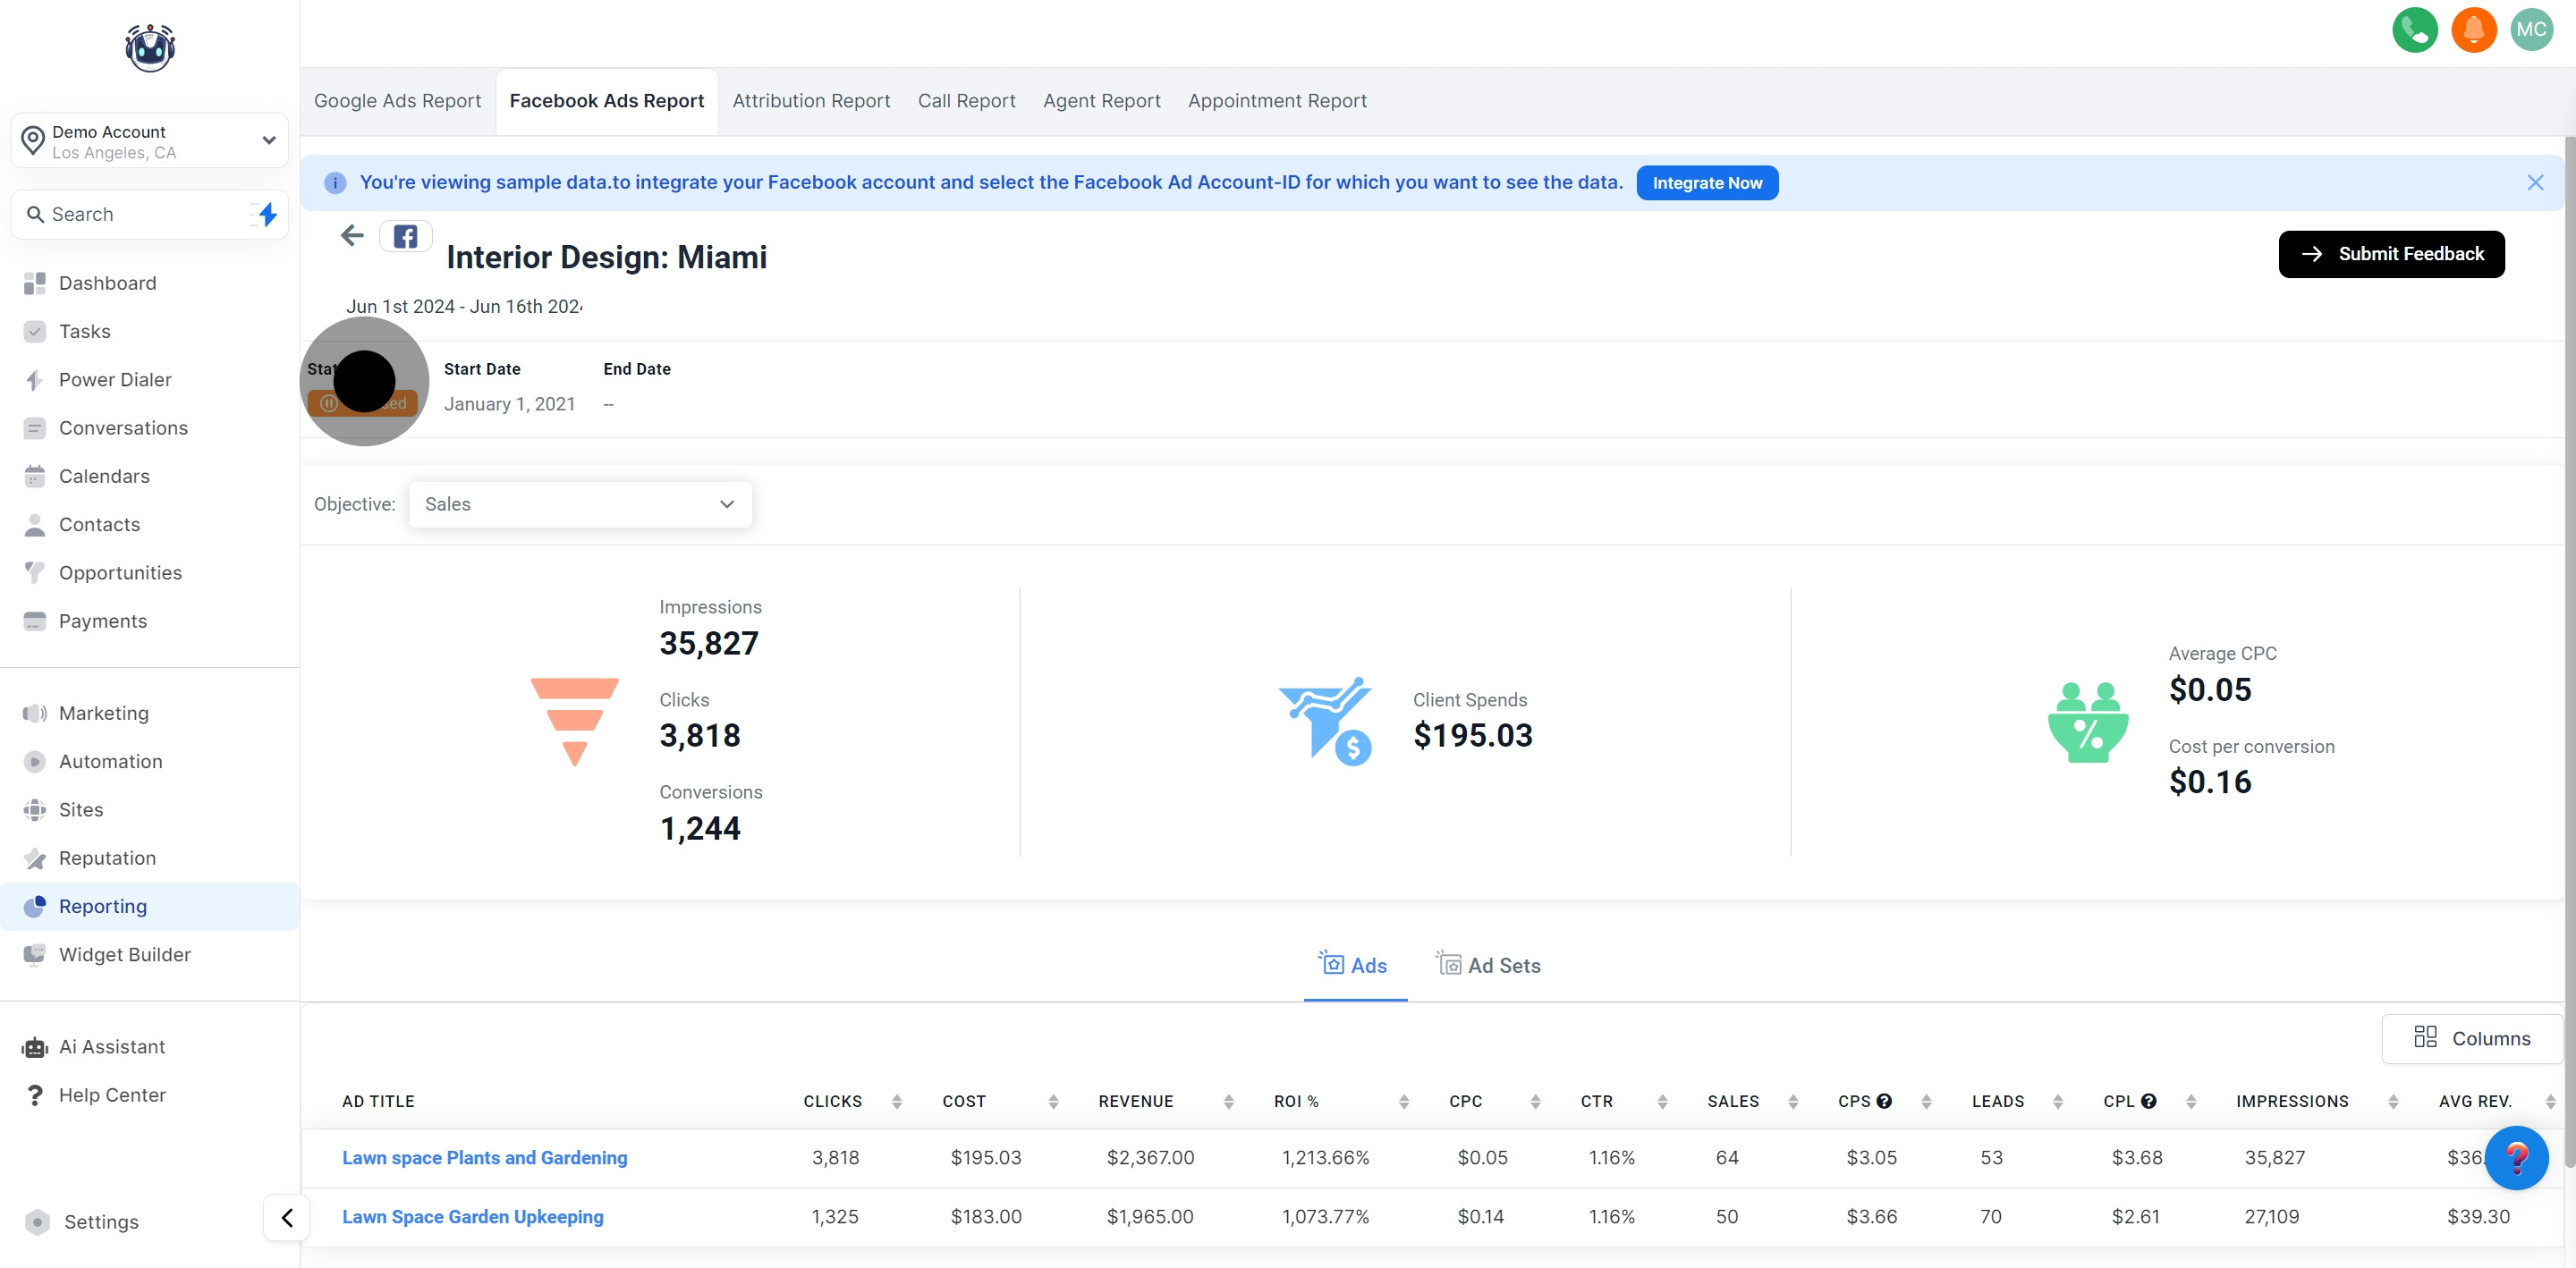
Shows the start date of the individual Facebook ad campaign.
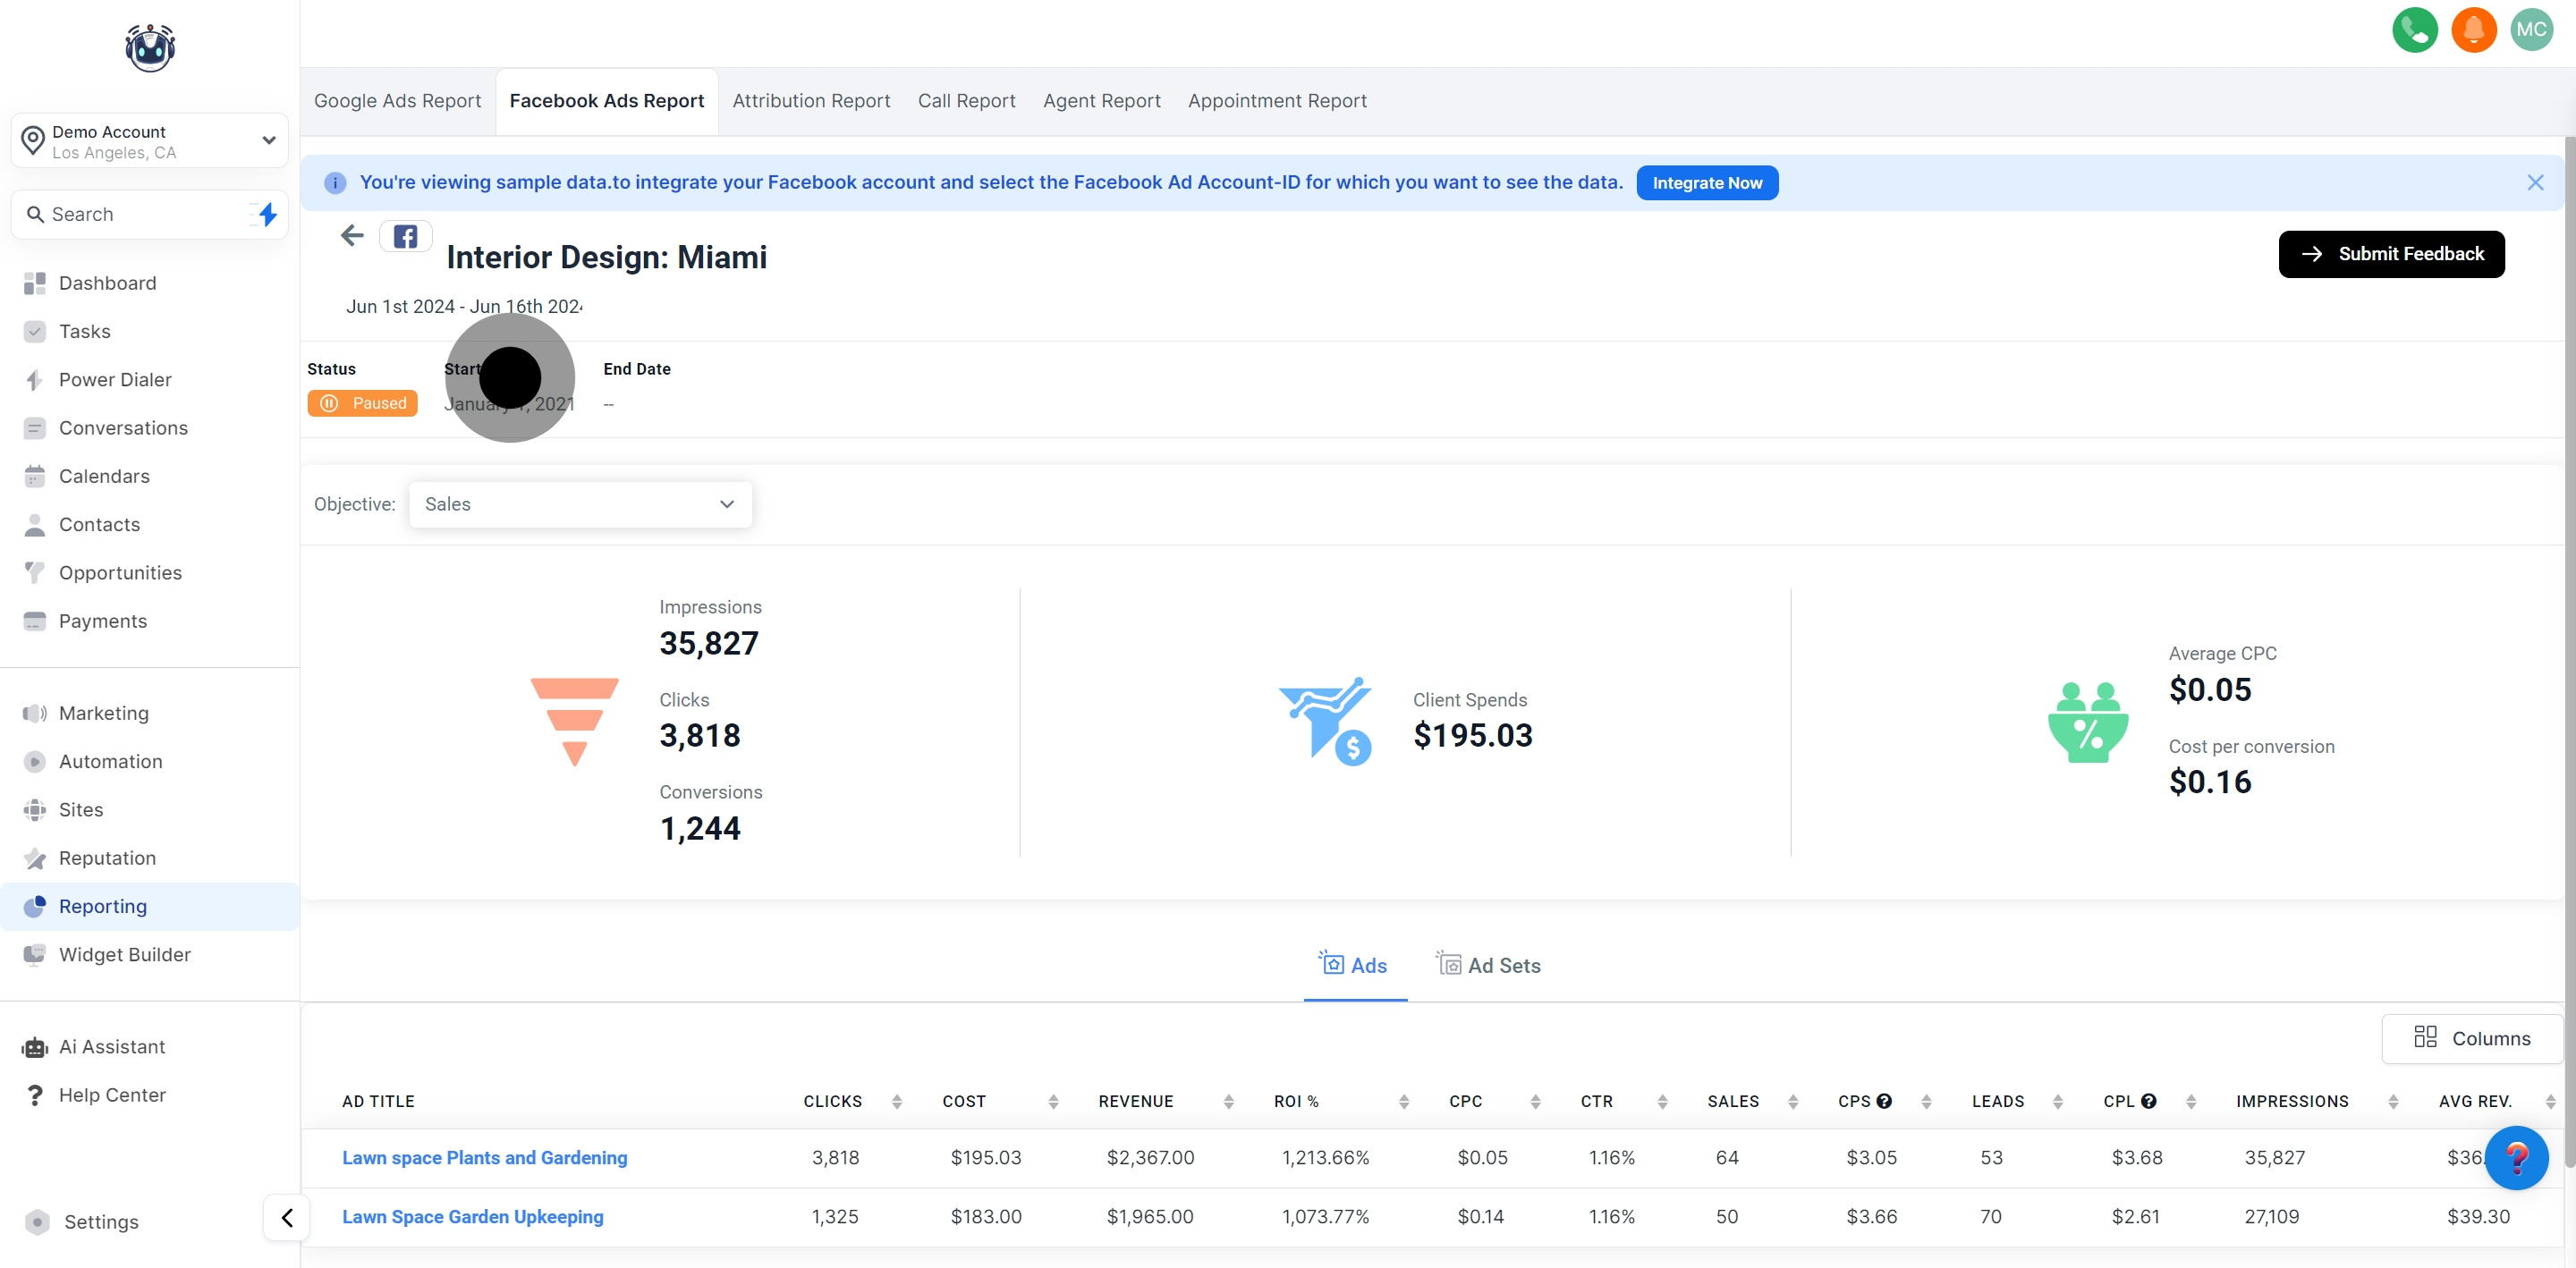
Indicates the end date of the individual Facebook ad campaign.
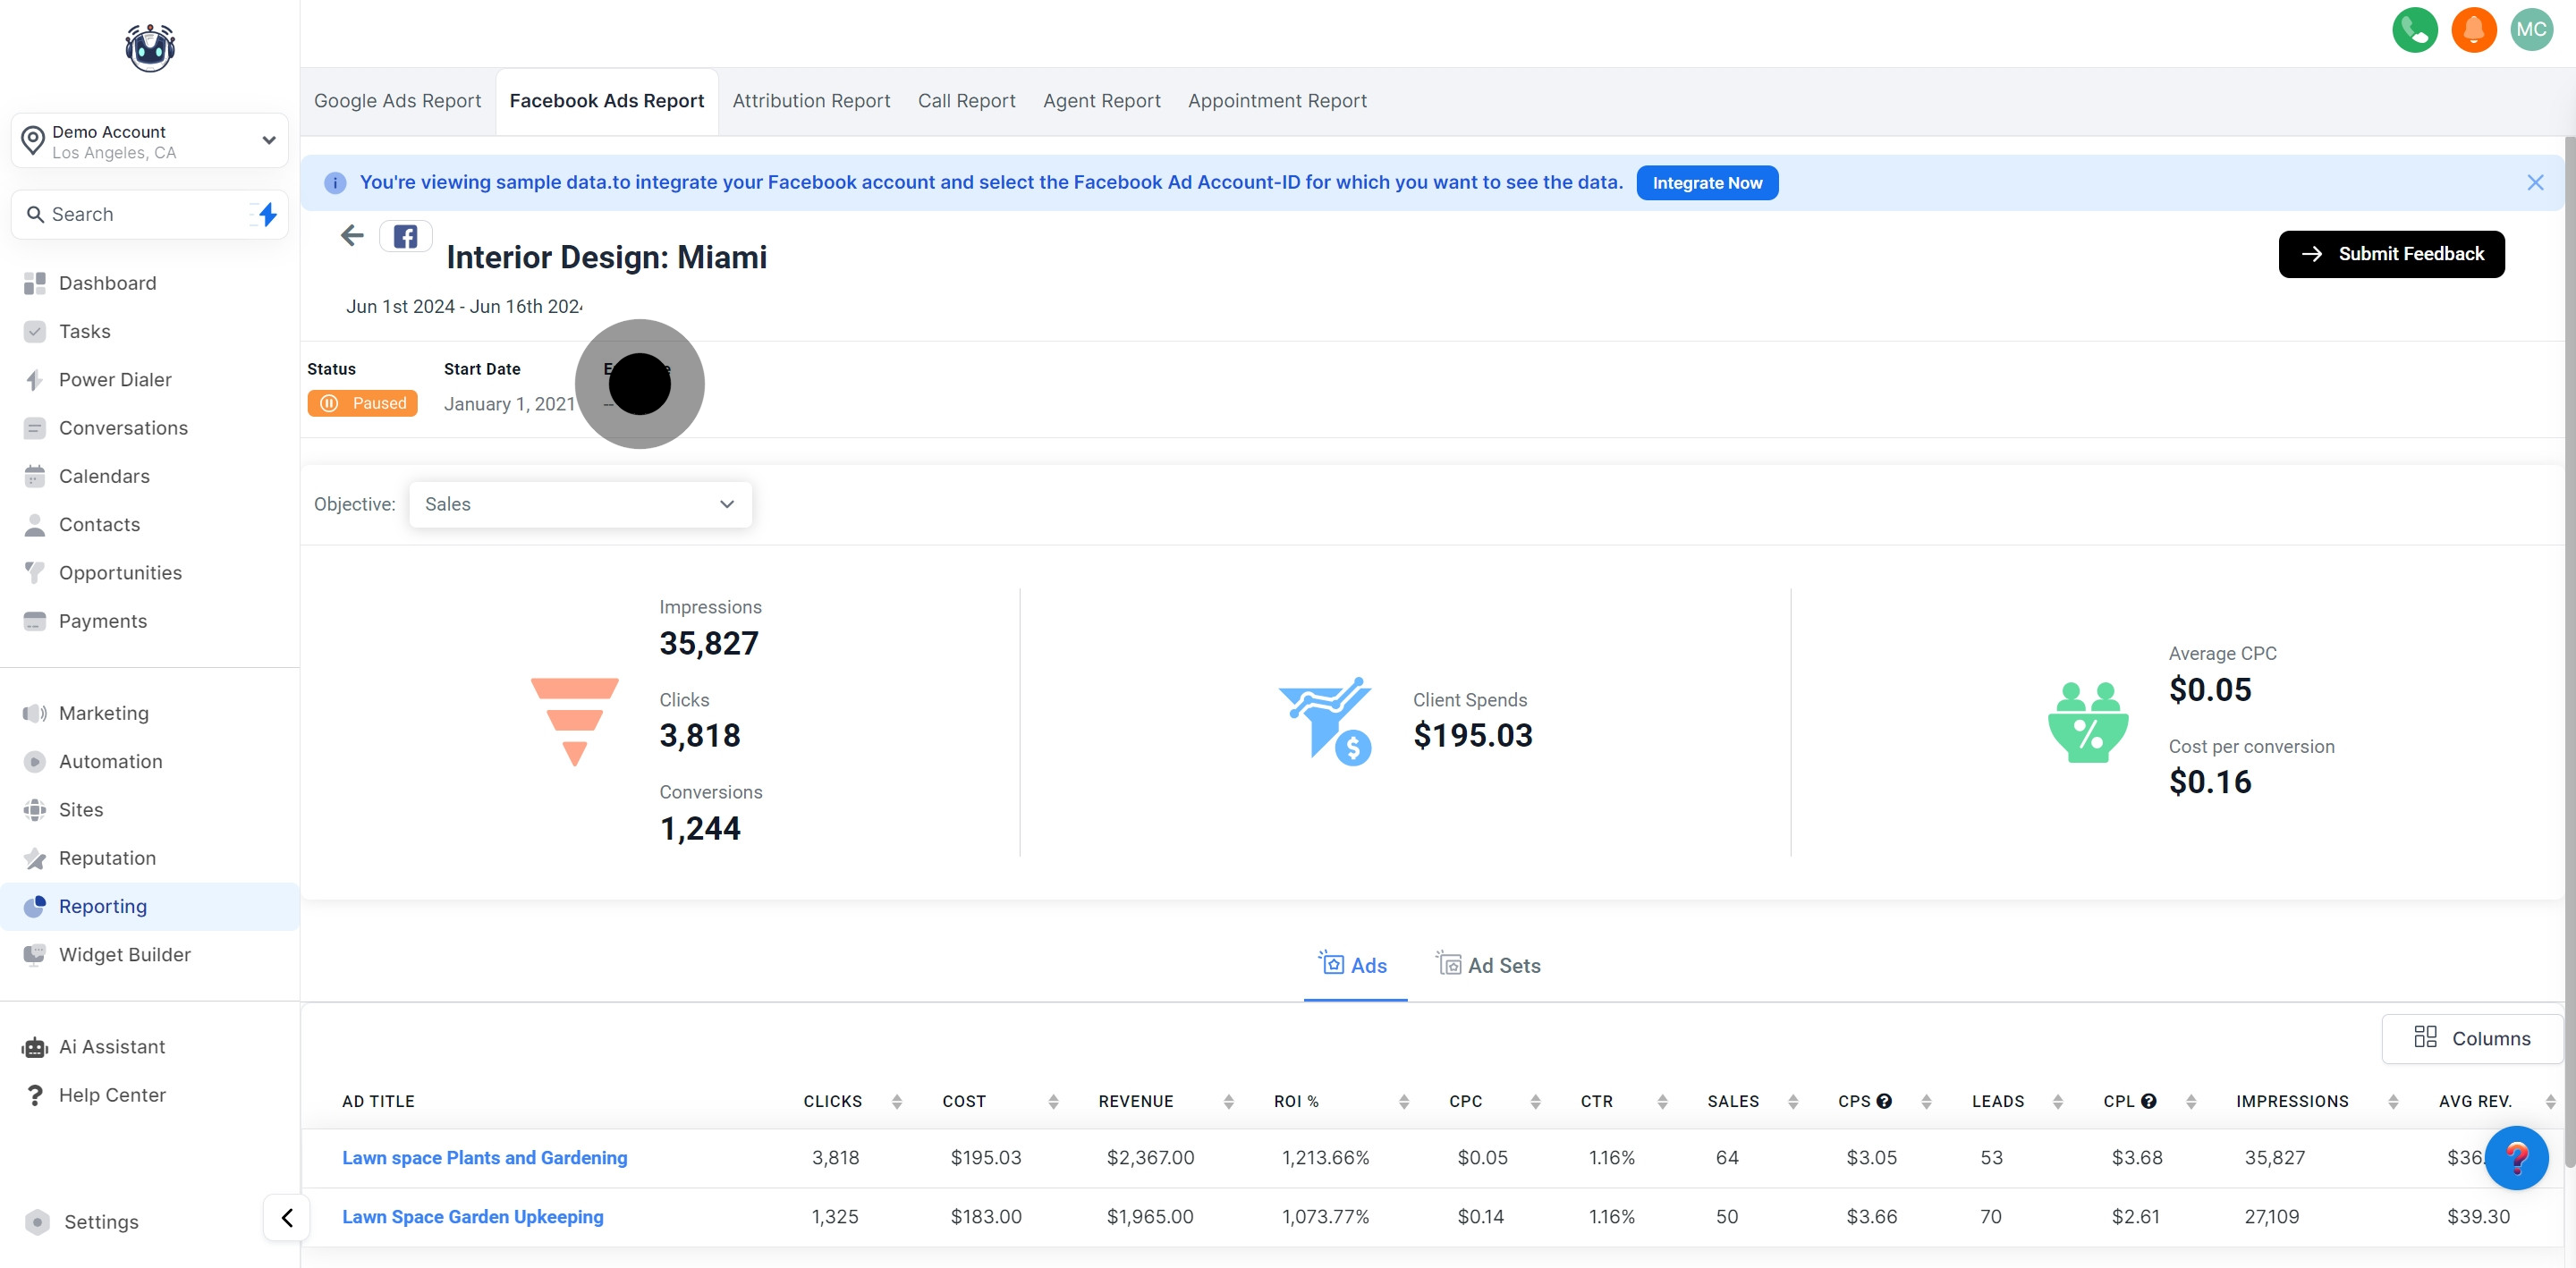
Shows the count of times the Facebook ad from the selected campaign was displayed during a particular time span.
Indicates the count of times the Facebook ad from the chosen campaign was clicked.
Shows the number of times the Facebook ad achieved the intended result, based on the objective and settings.
Displays the total expenditure incurred on the Facebook ad campaign.
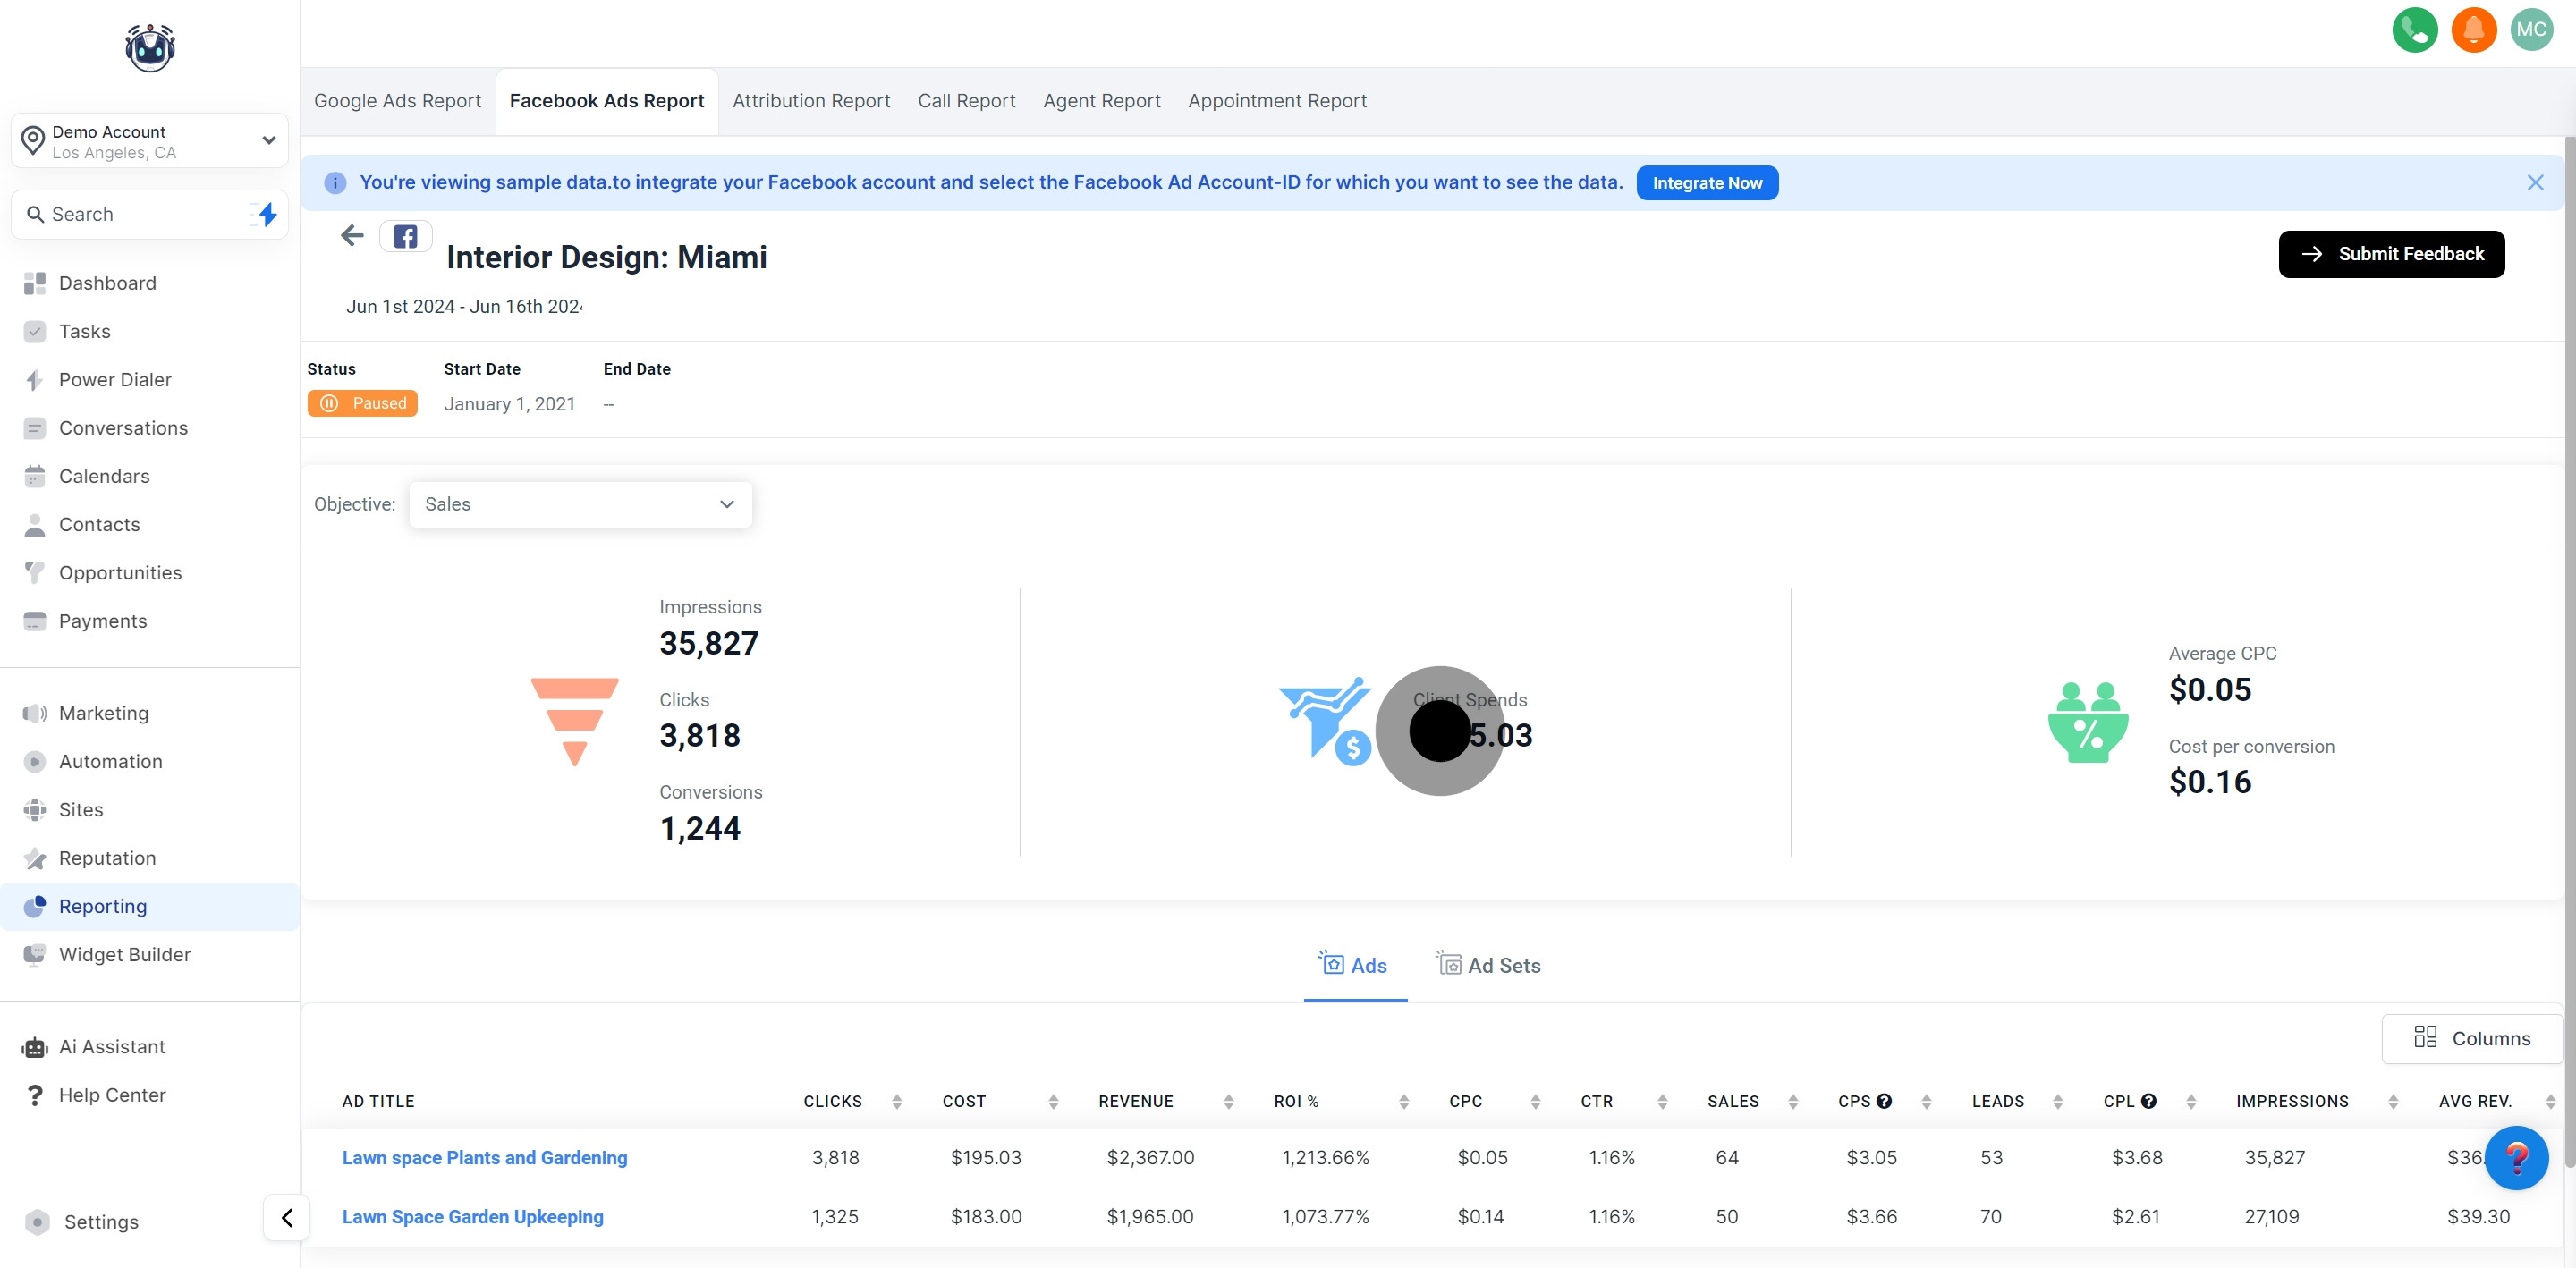
Shows the average Cost Per Click (CPC) for the selected Facebook ad campaign.
Displays the cost per conversion for the chosen Facebook ad campaign.
Reporting Types provide data regarding the ads and ad sets utilized in a Facebook ad campaign. Easily view ad statistics at a macro or micro level according to your preferences!