Help center
Go to Pest AI
How to Use Table Charts for Dashboard Widgets | Pest AI
All collections
Dashboard
How to Use Table Charts for Dashboard Widgets
How to Use Table Charts for Dashboard Widgets
Discover how to effectively utilize table charts as dashboard widgets to organize and present data in a clear, structured format.
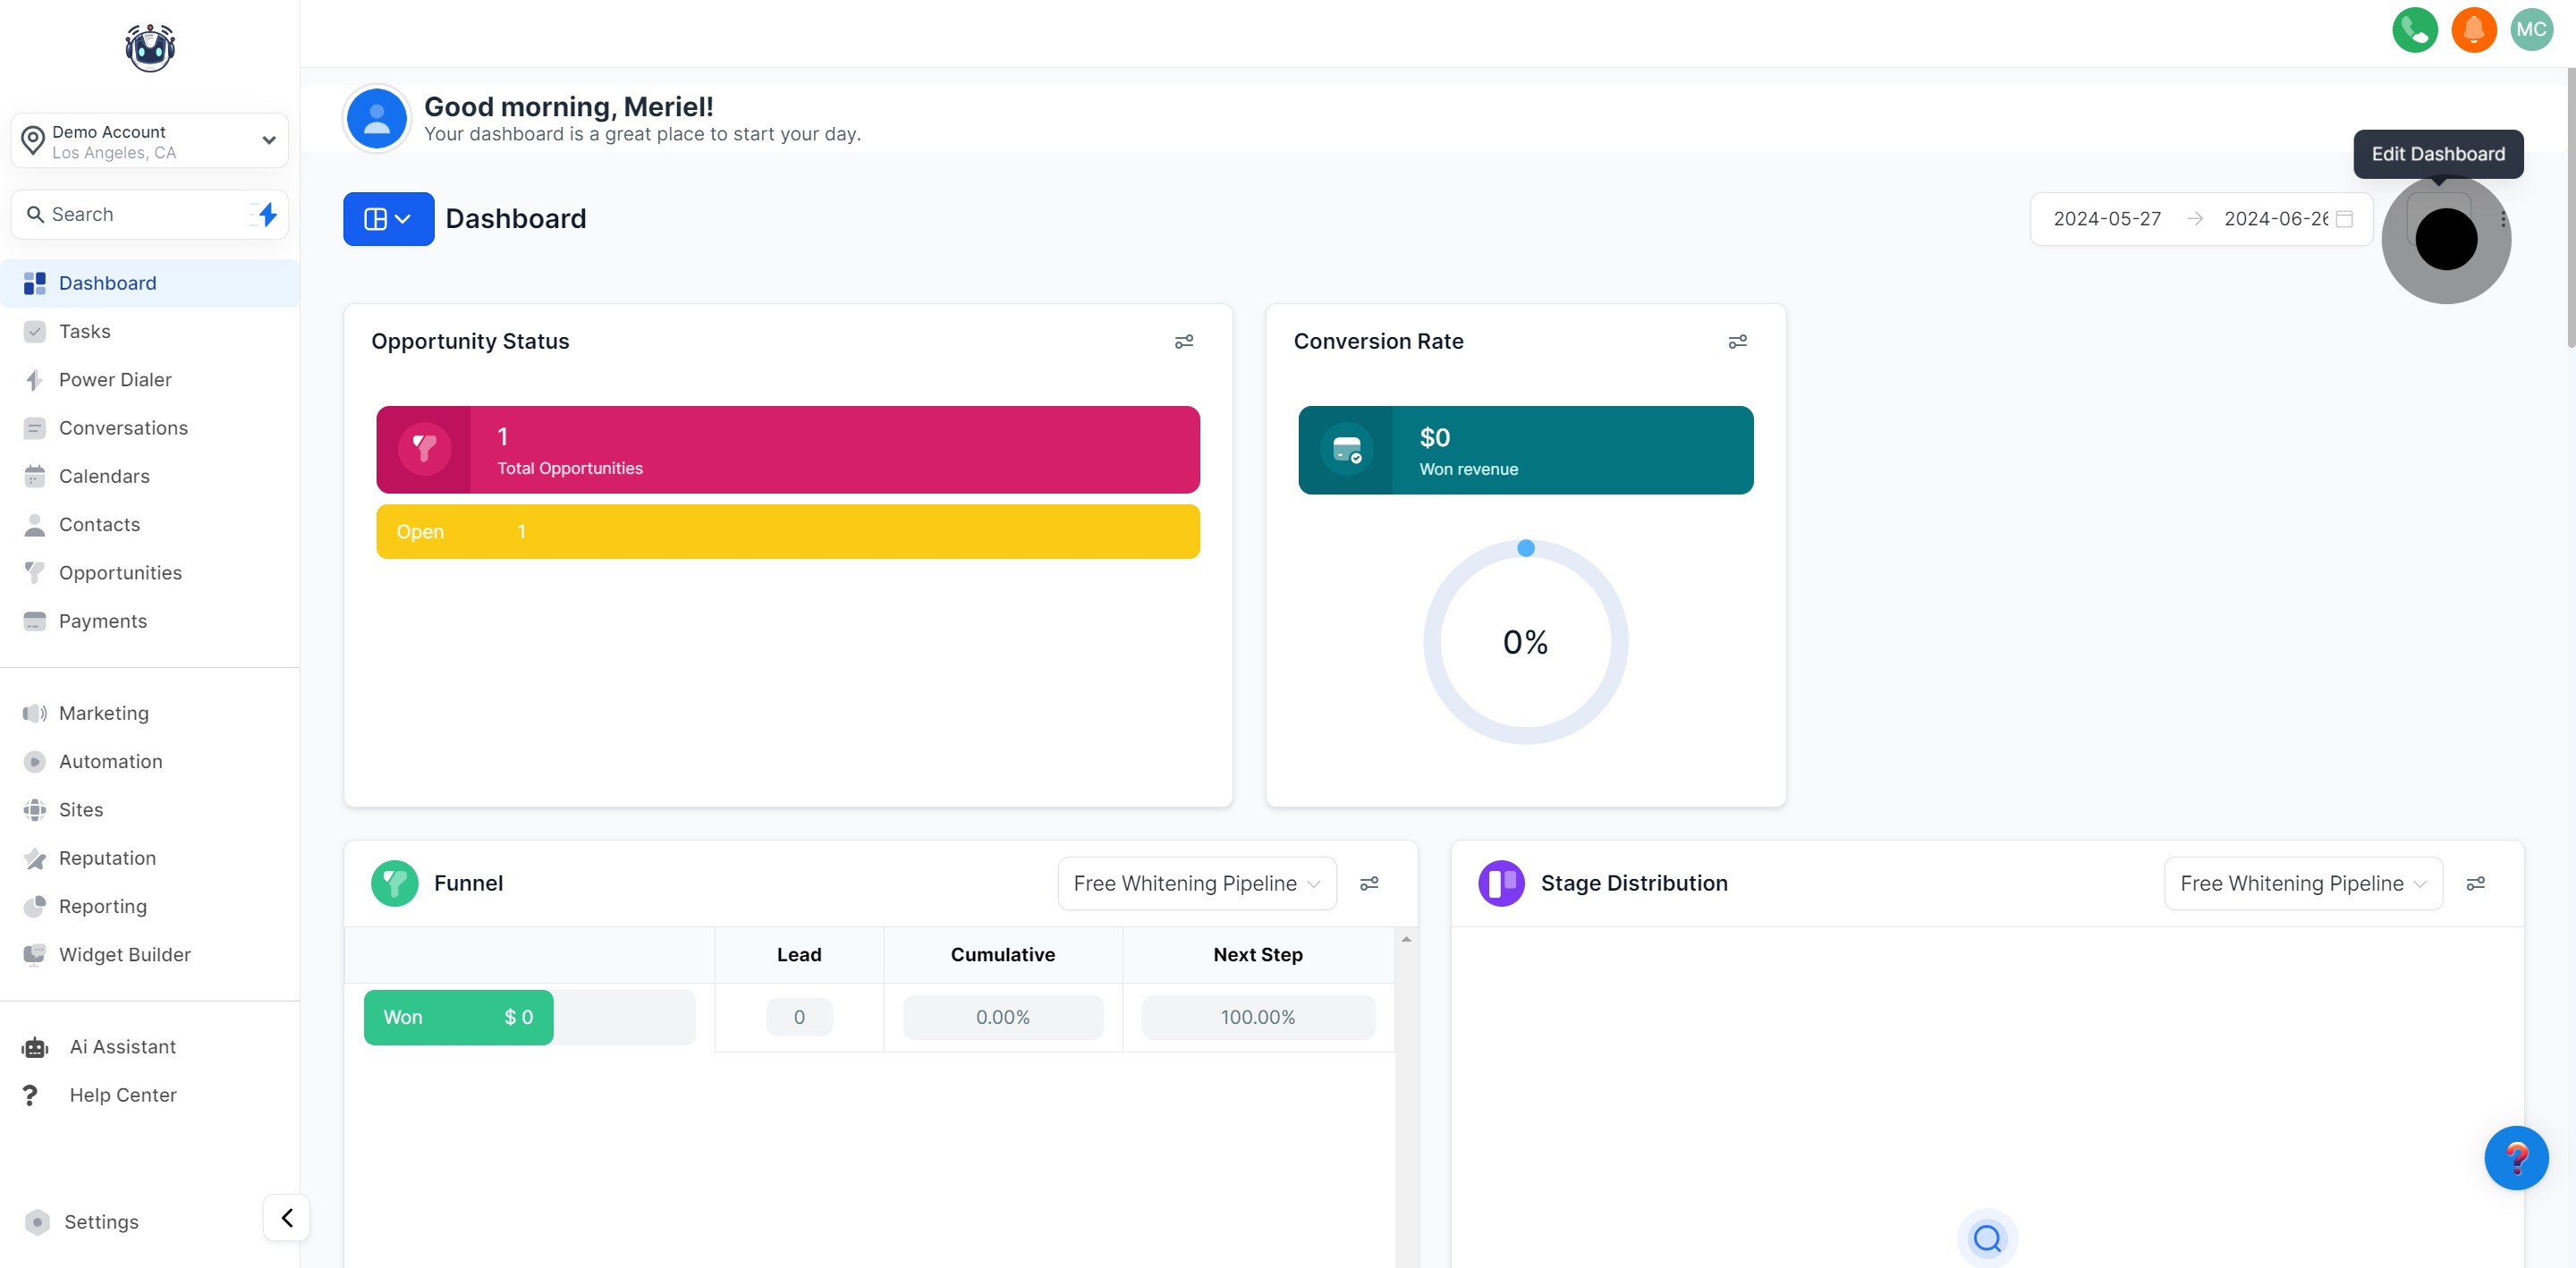
1. Begin by editing your dashboard.
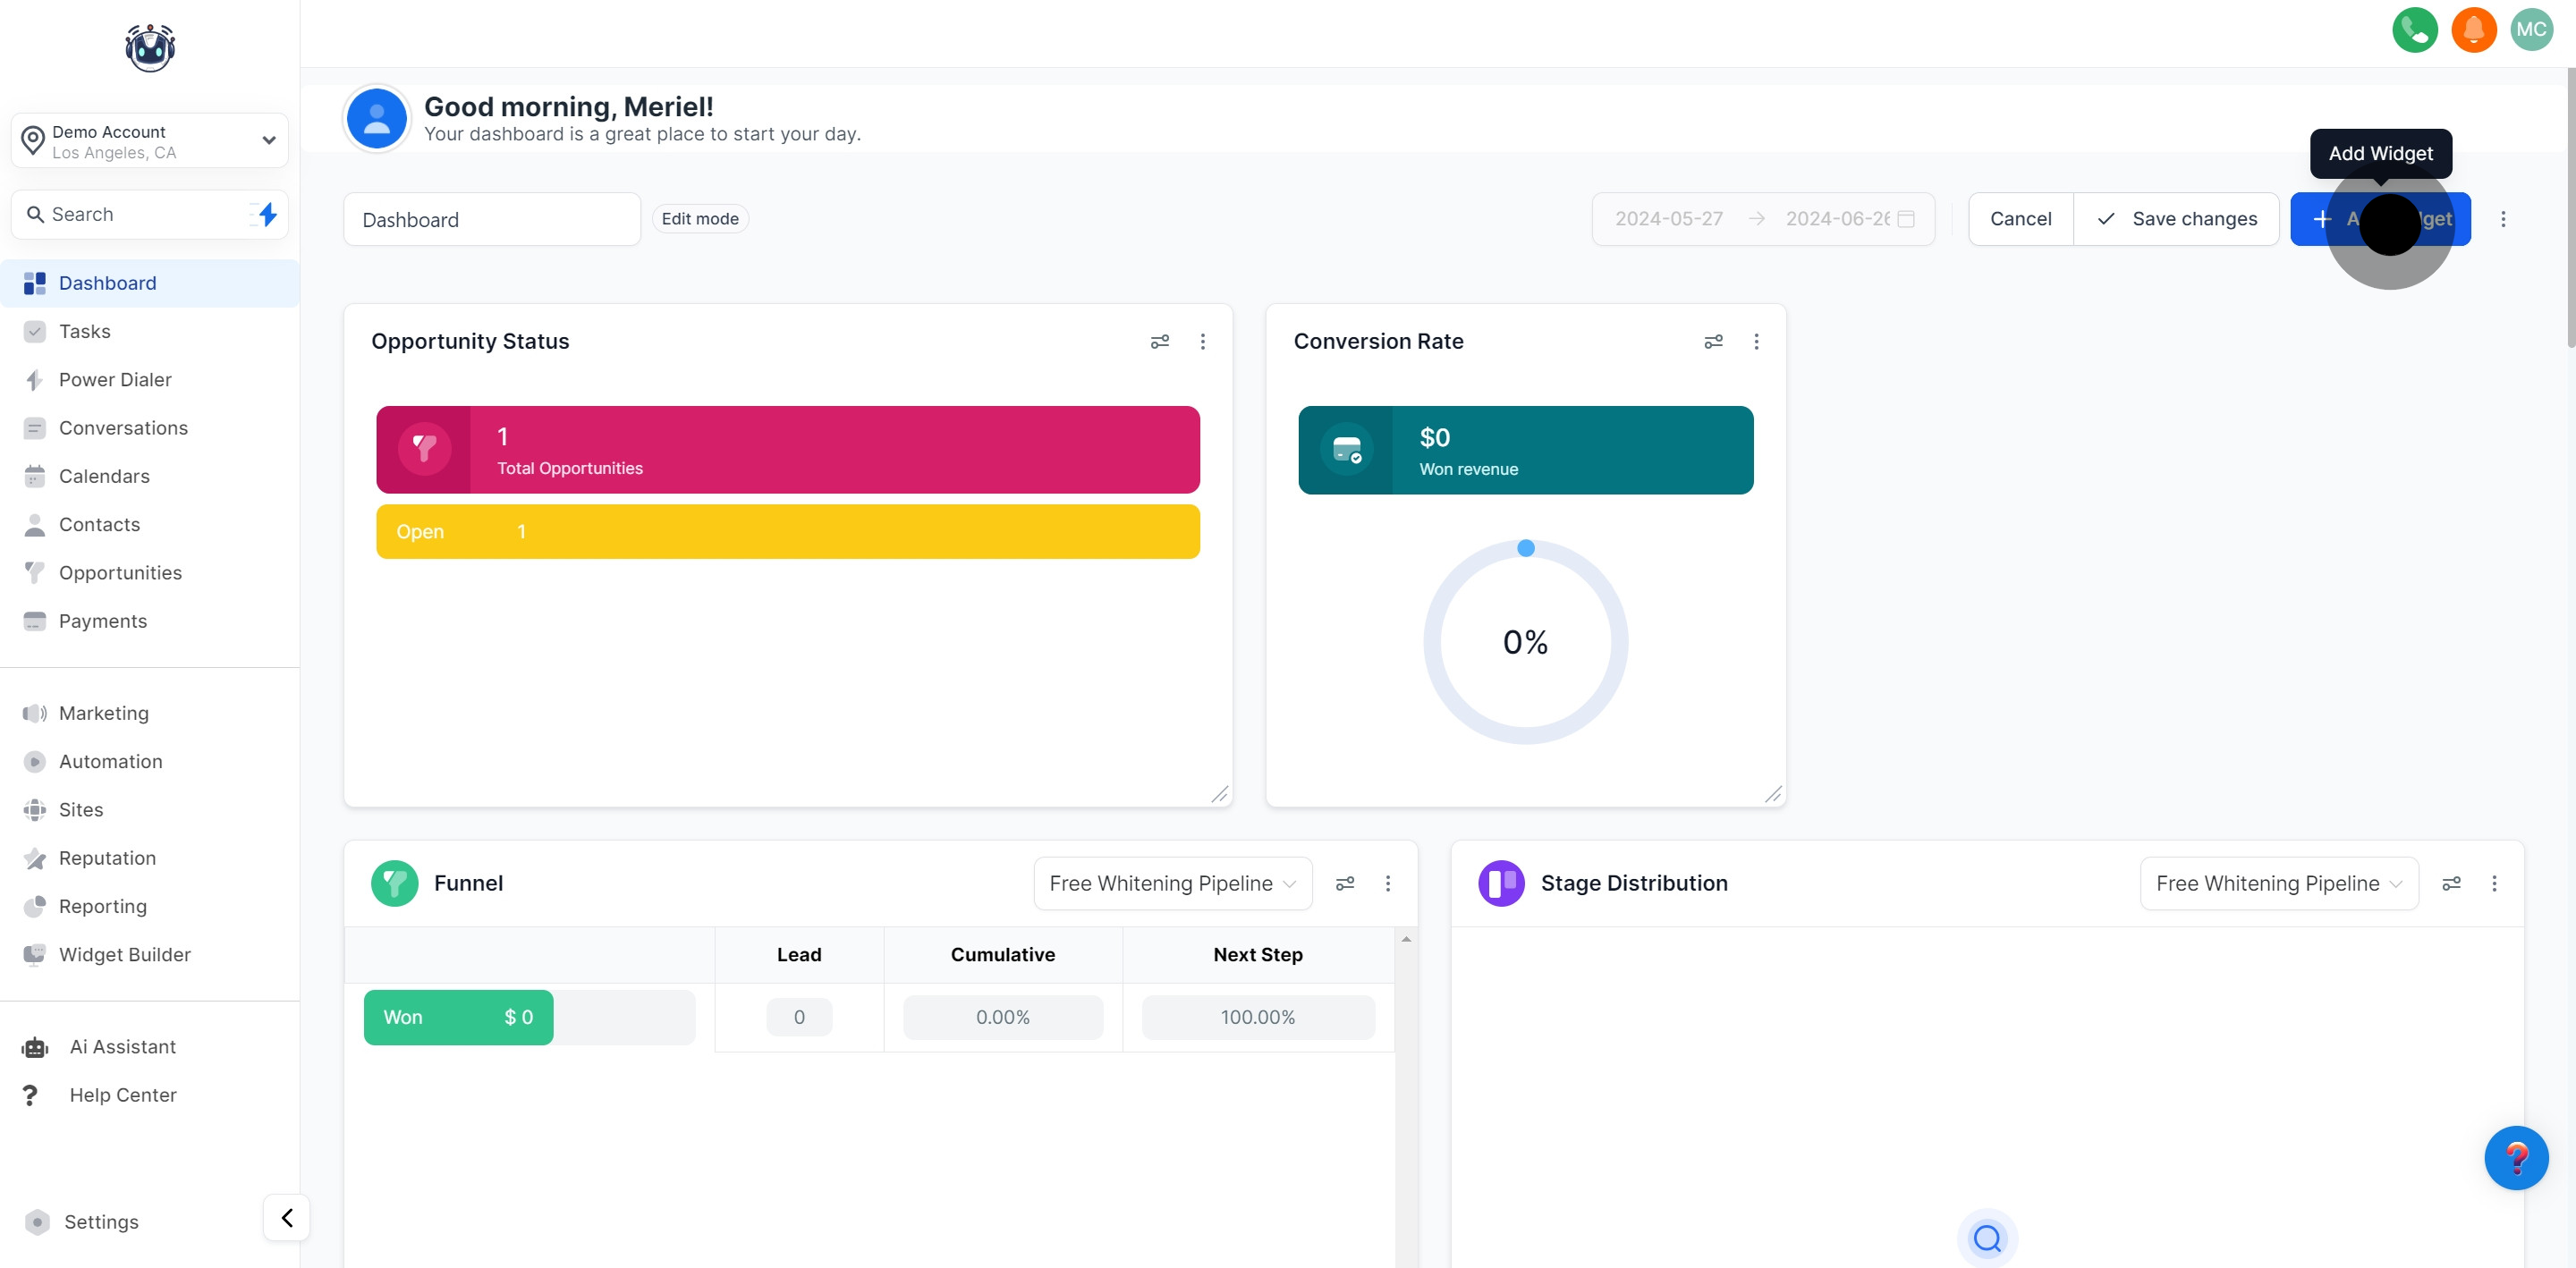
2. Next, add a new widget.
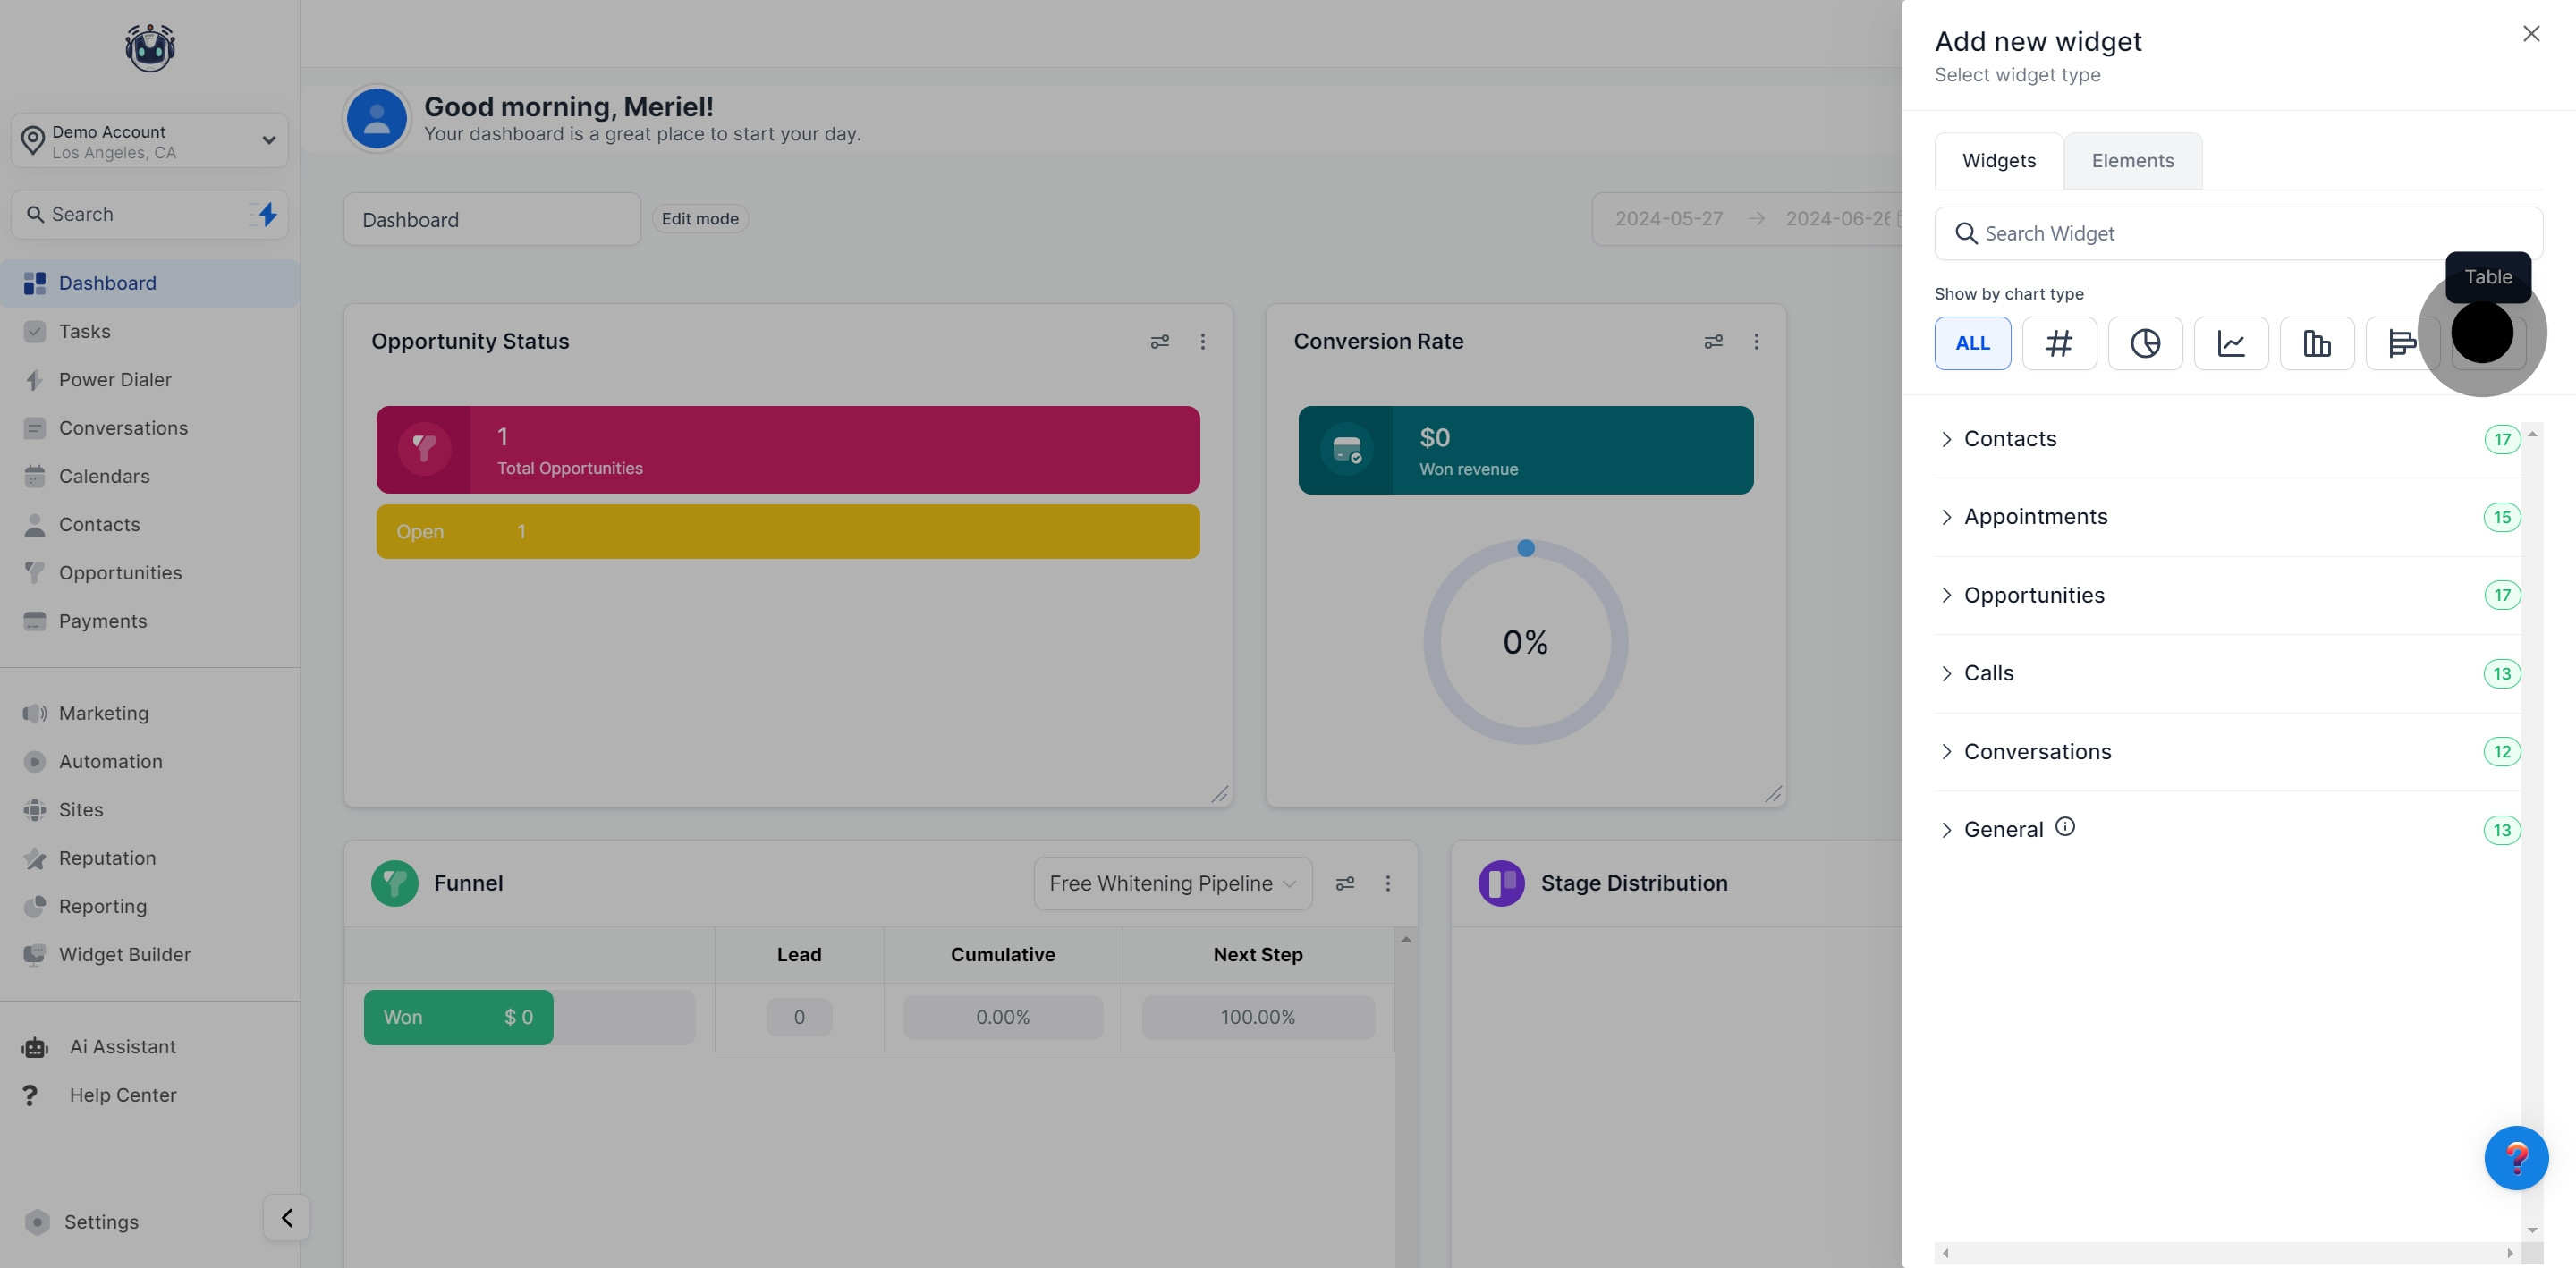
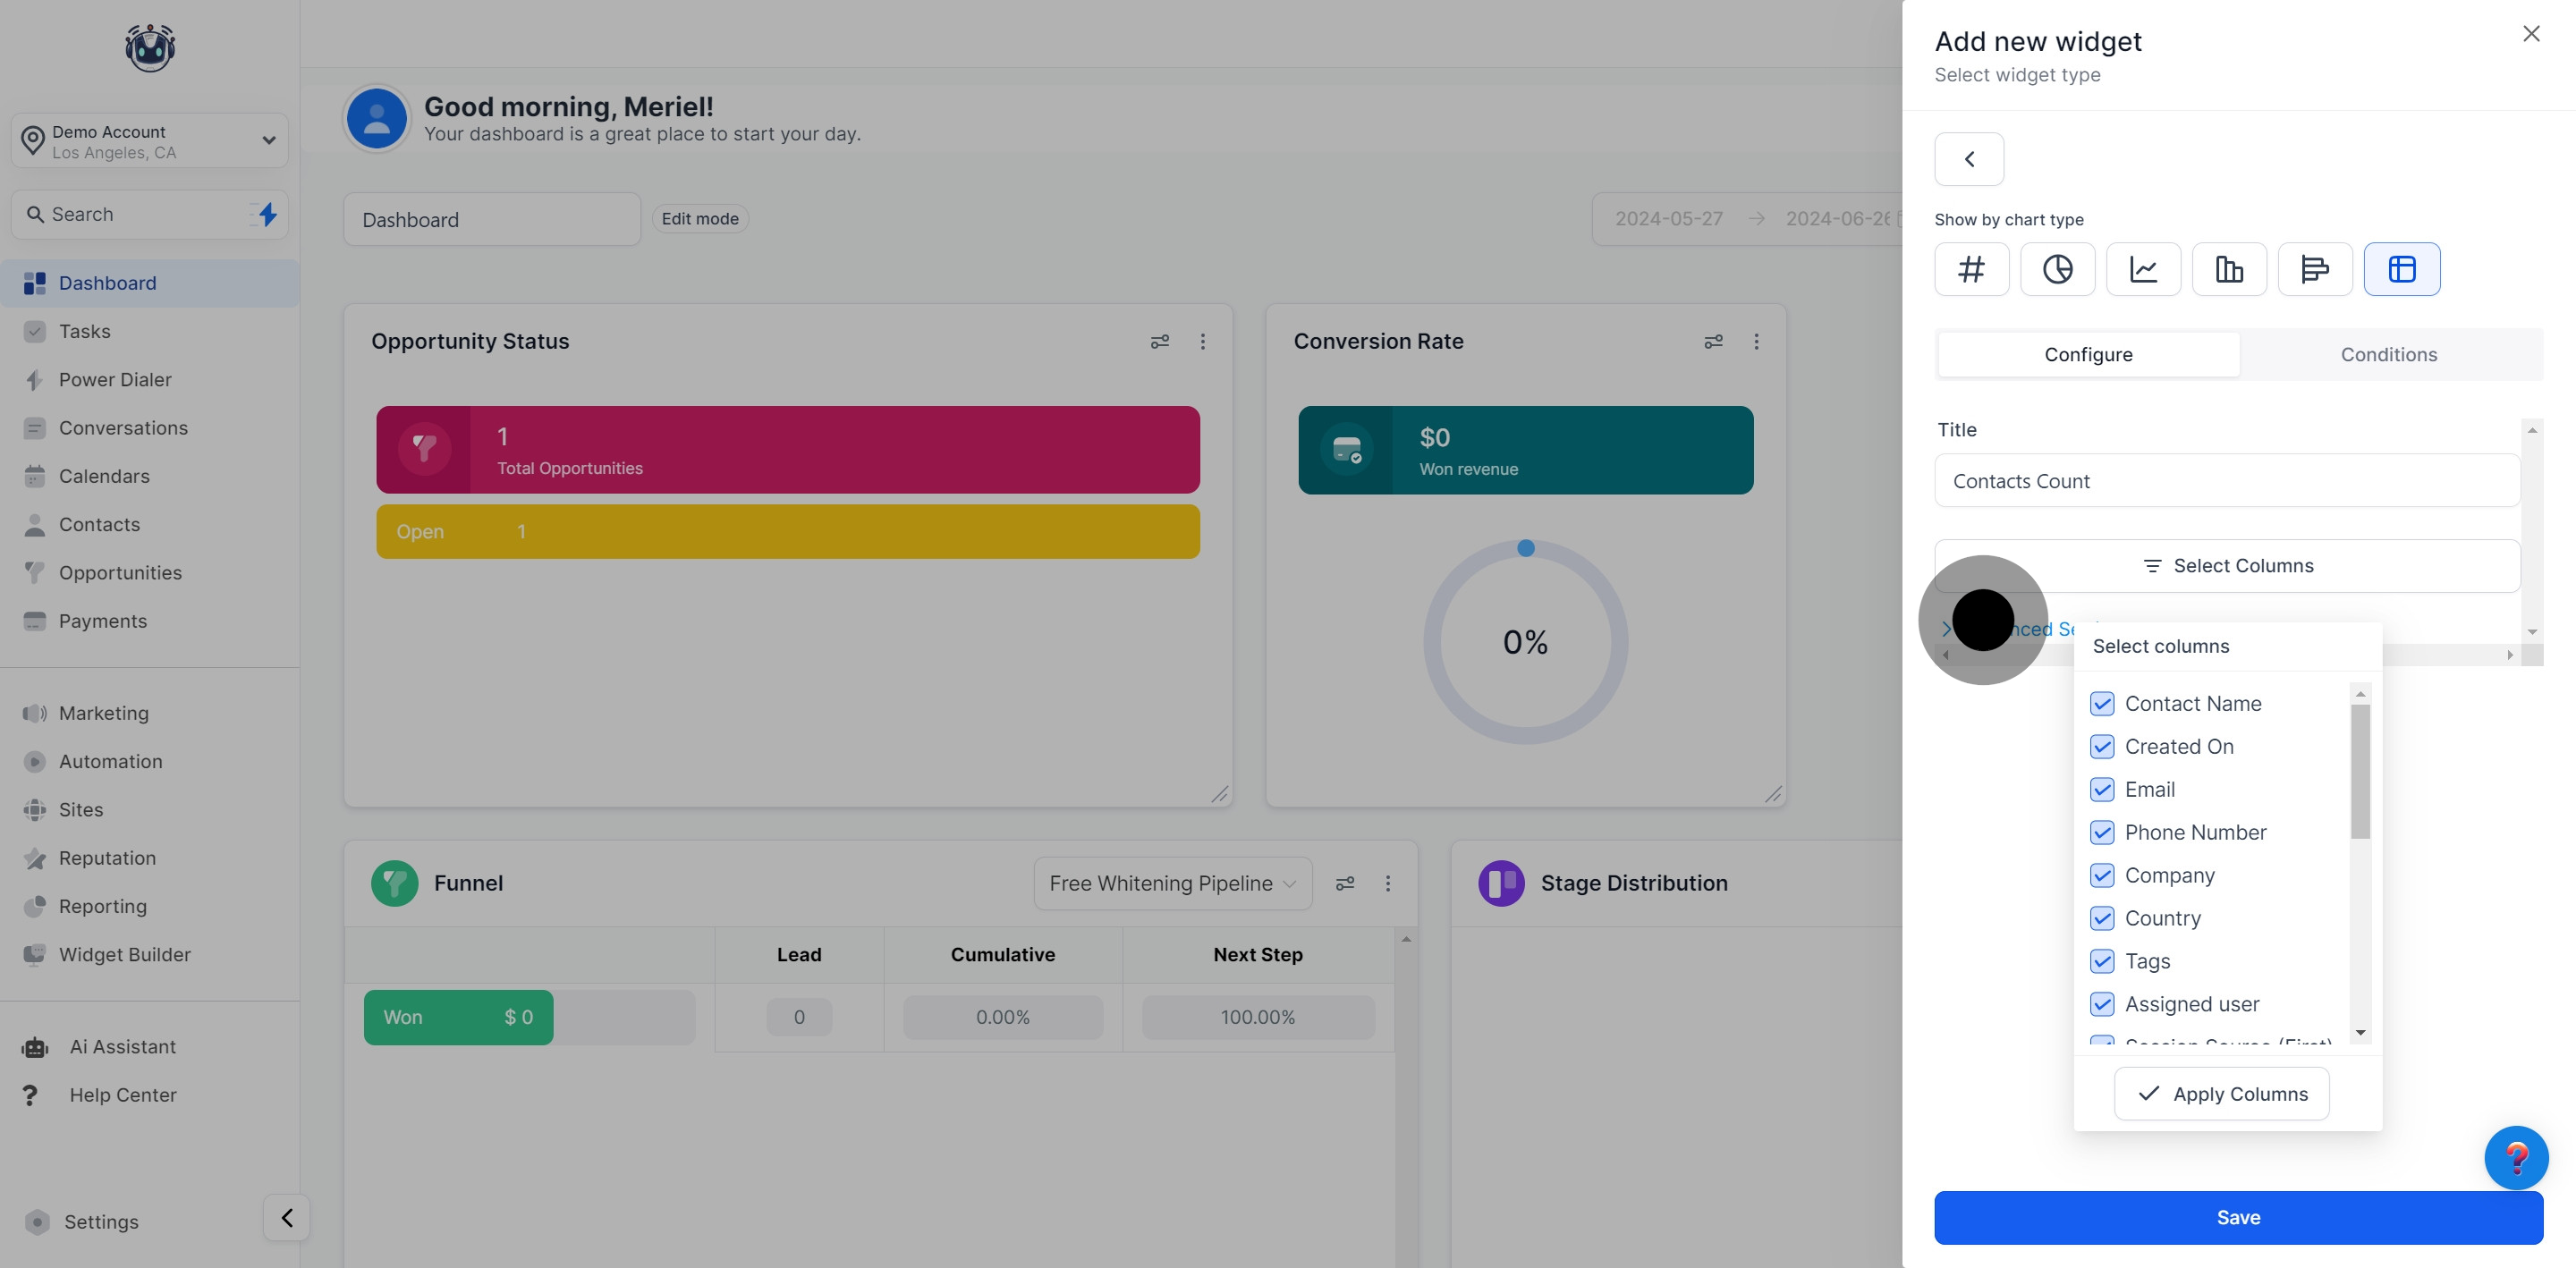
3. Then, select the 'Table' option for your widget.
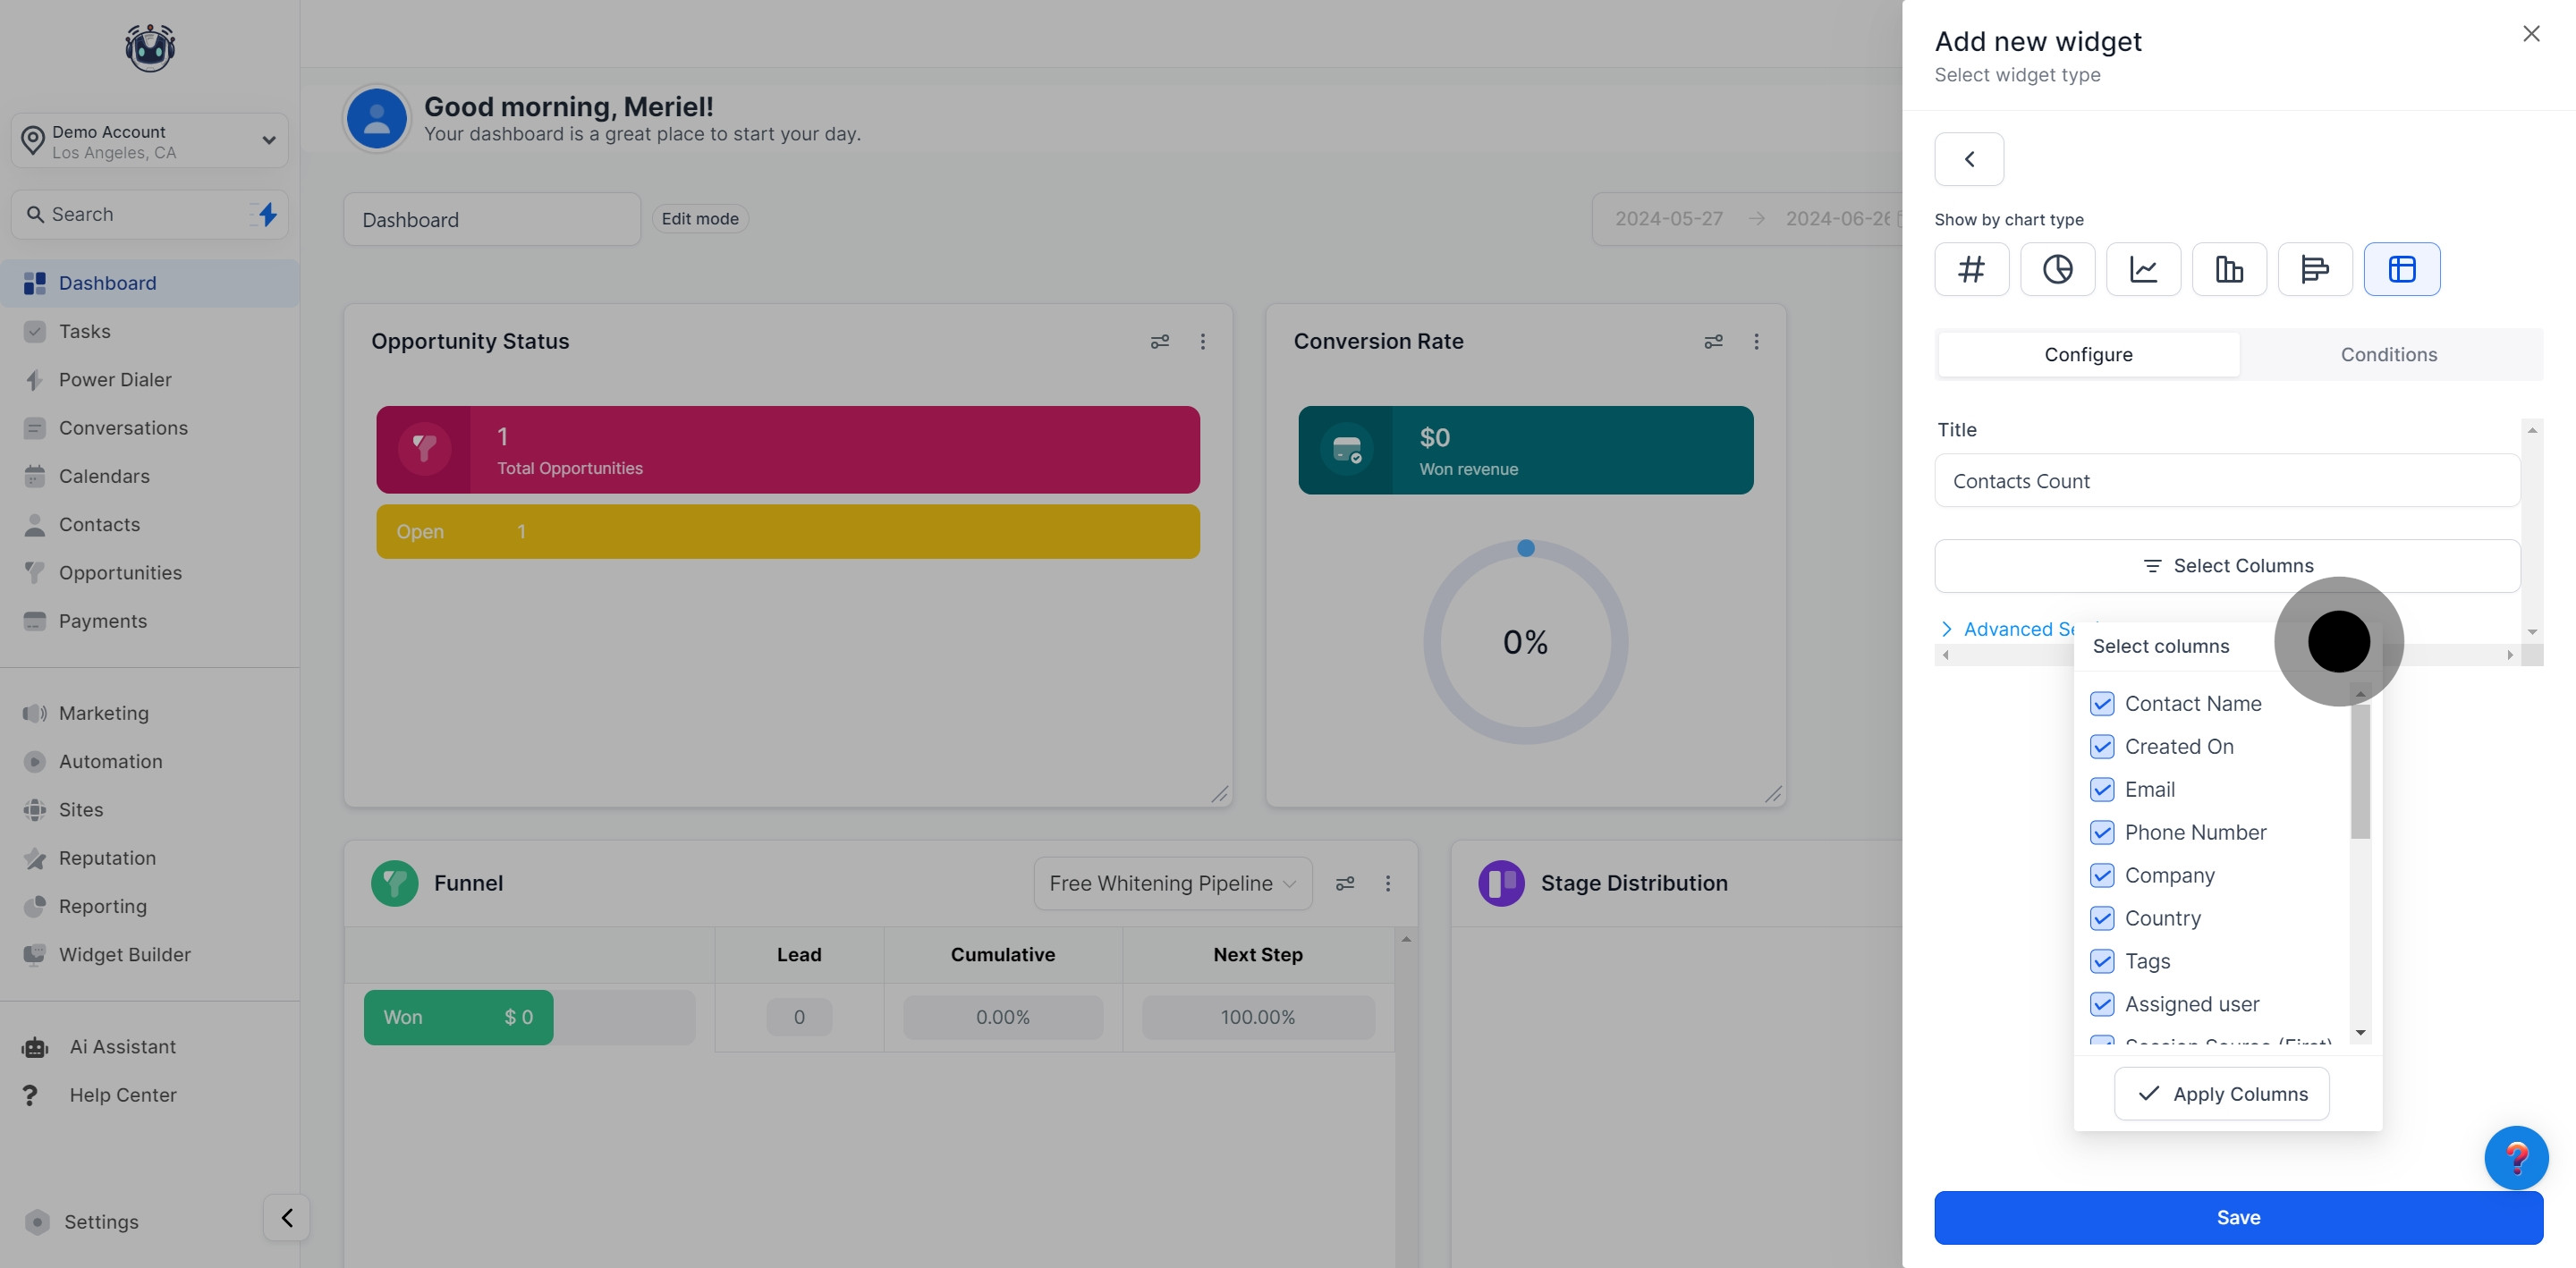
4. Now, configure columns for your table widget.
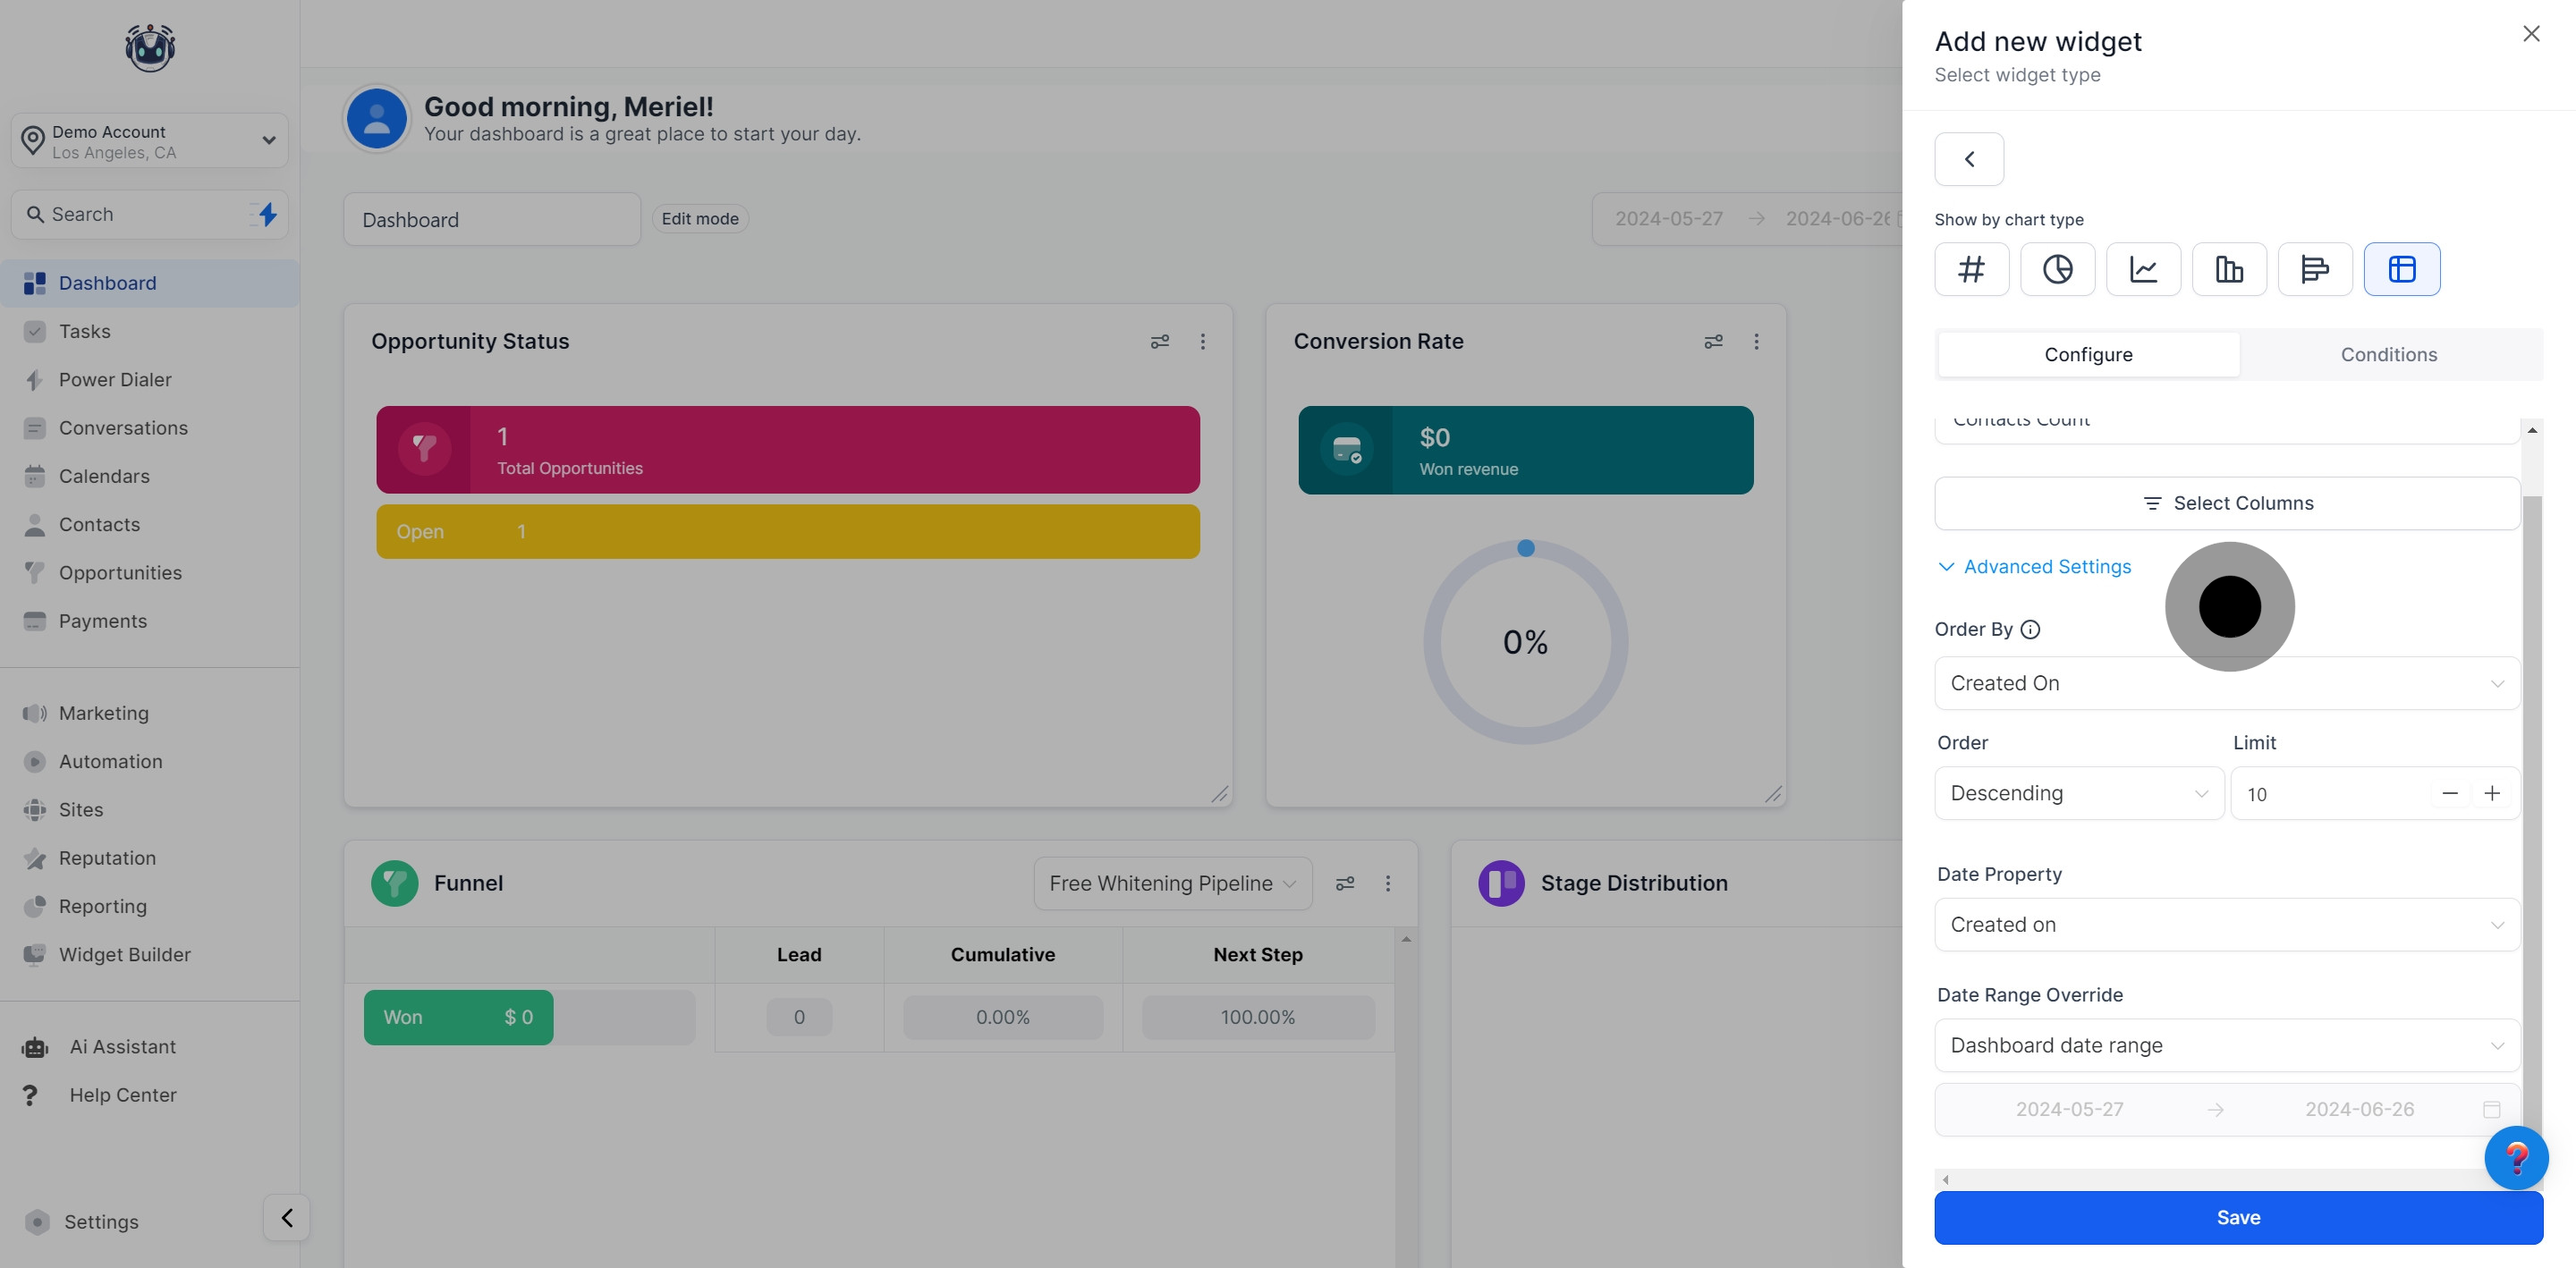
5. Afterwards, access advanced settings.
6. Within advanced settings, specify your sorting preference.
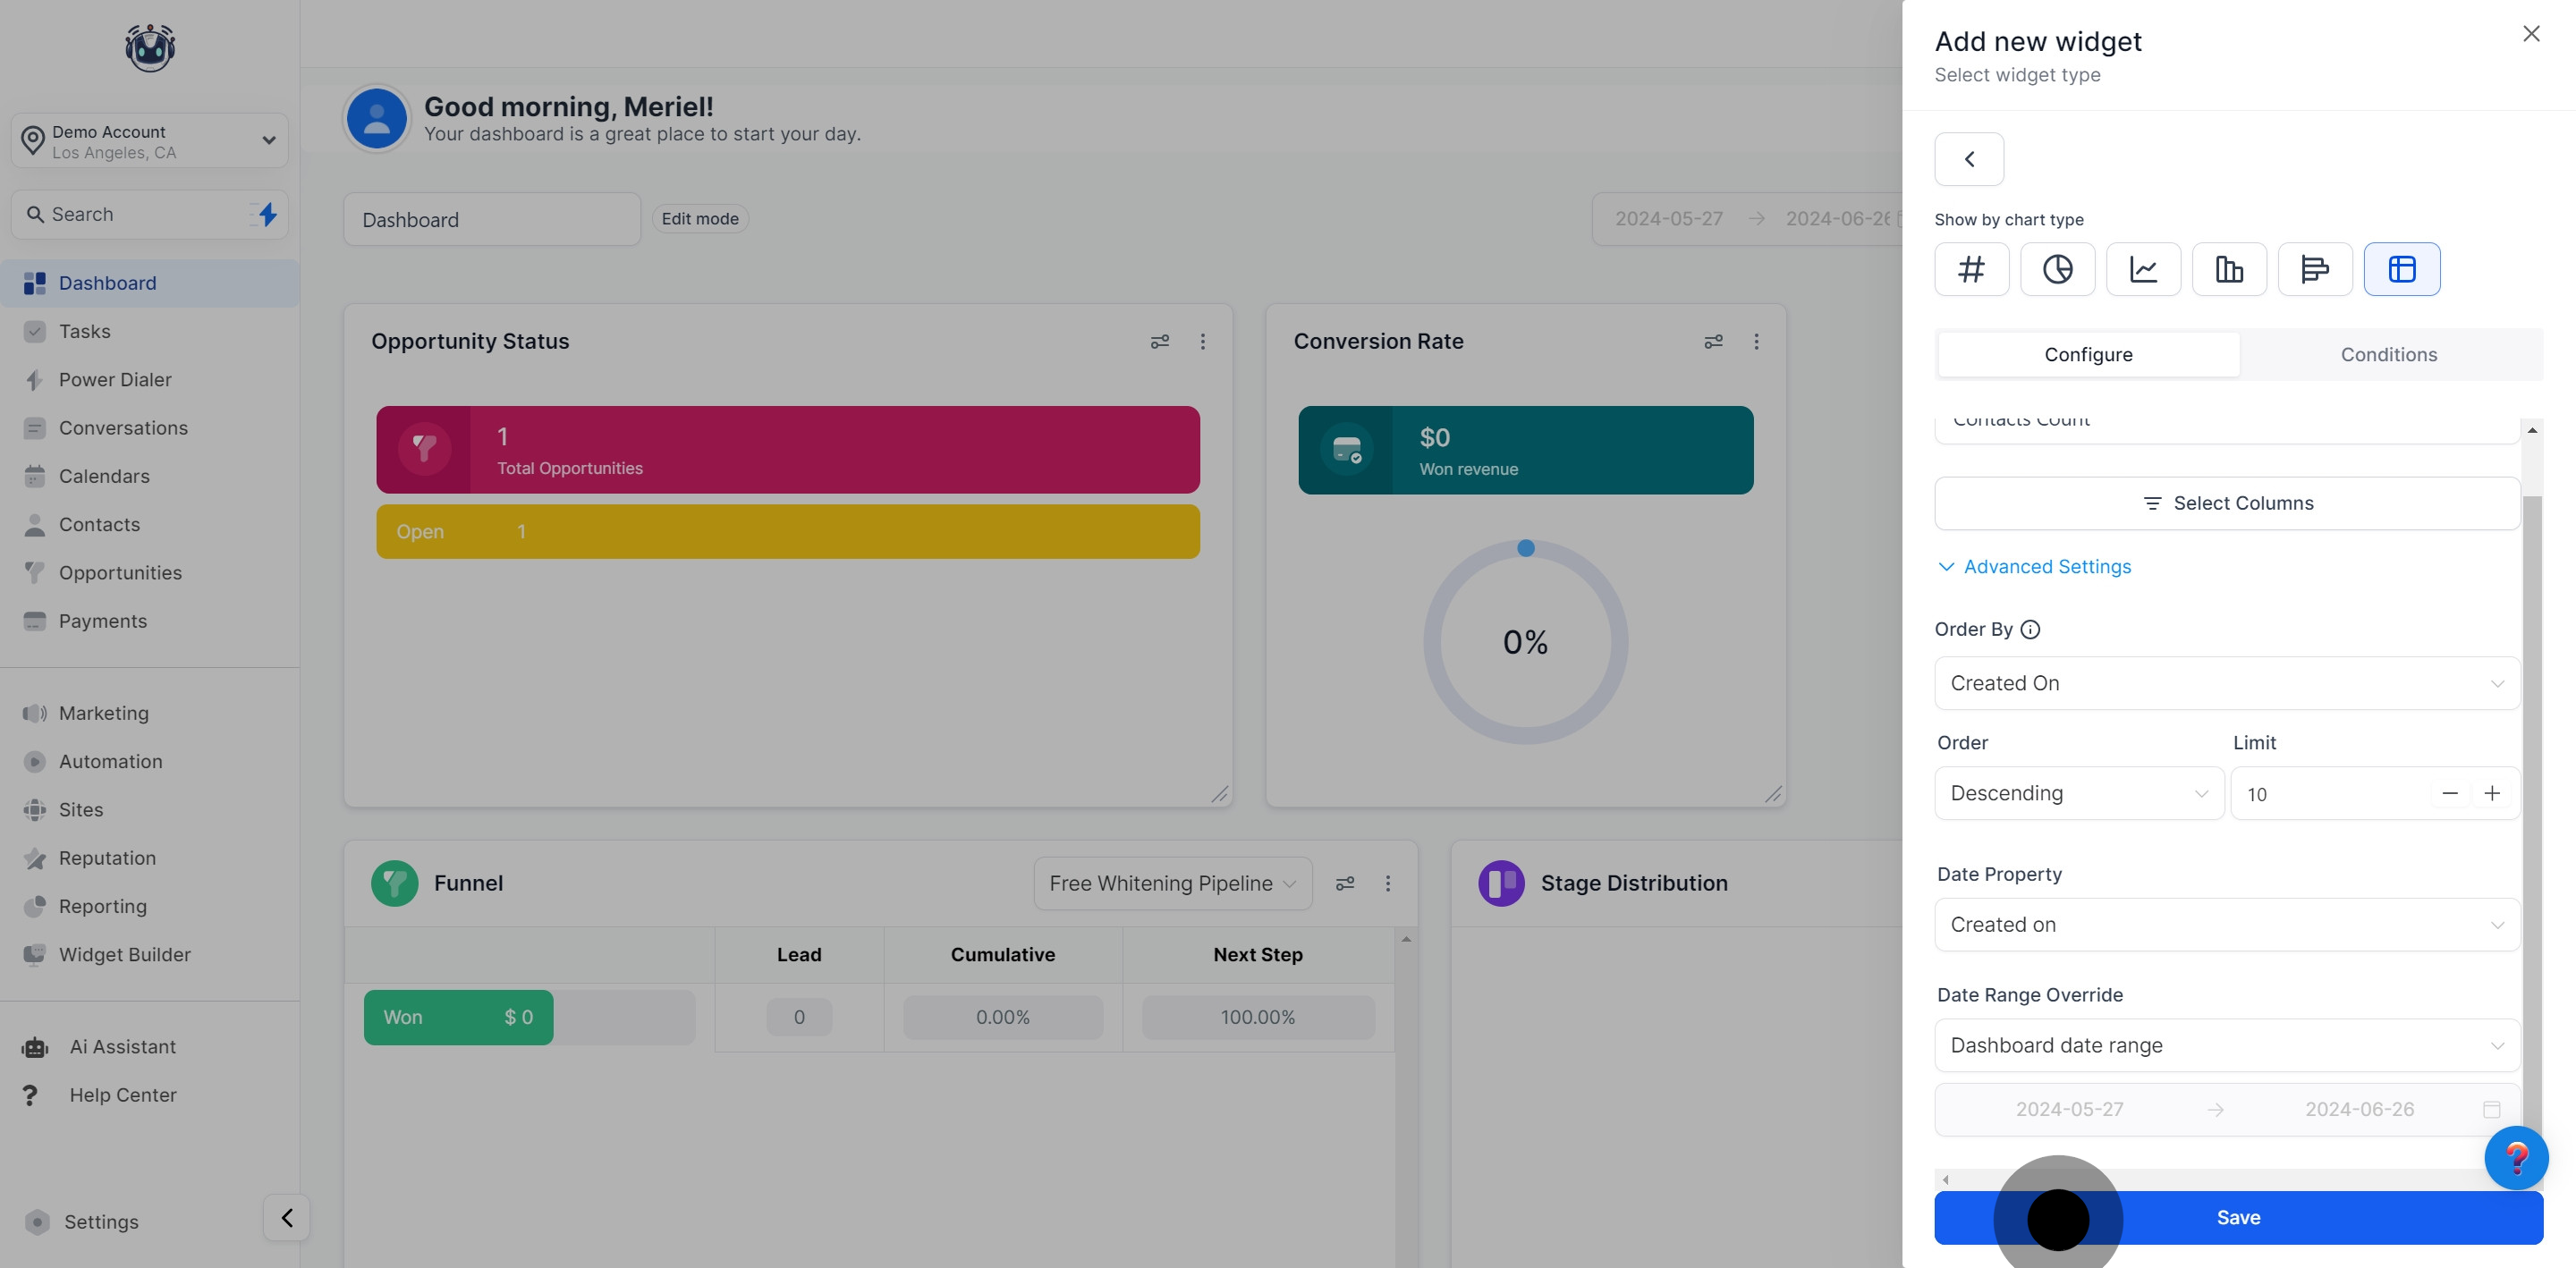
7. Finally, save your widget to update the dashboard.
Did this answer your question?
😞
😐
😁