With this update, users can create, manage, and customize multiple dashboards, tailoring their data visualization to their unique needs. These features empower users to enhance their analytical capabilities, providing a more intuitive and personalized experience.
Enhanced Flexibility: Users can now create multiple dashboards, organizing and viewing data according to their preferences rather than being confined to a single dashboard.
Time Savings: The ability to clone dashboards makes it easy to create new ones with similar configurations, saving users time and effort.
Granular Control: Custom permissions allow users to selectively share data, giving them precise control over who can view specific dashboards.
Organized Insights: Users can delete unnecessary dashboards and pin their favorites, maintaining a clutter-free and well-organized dashboard environment.
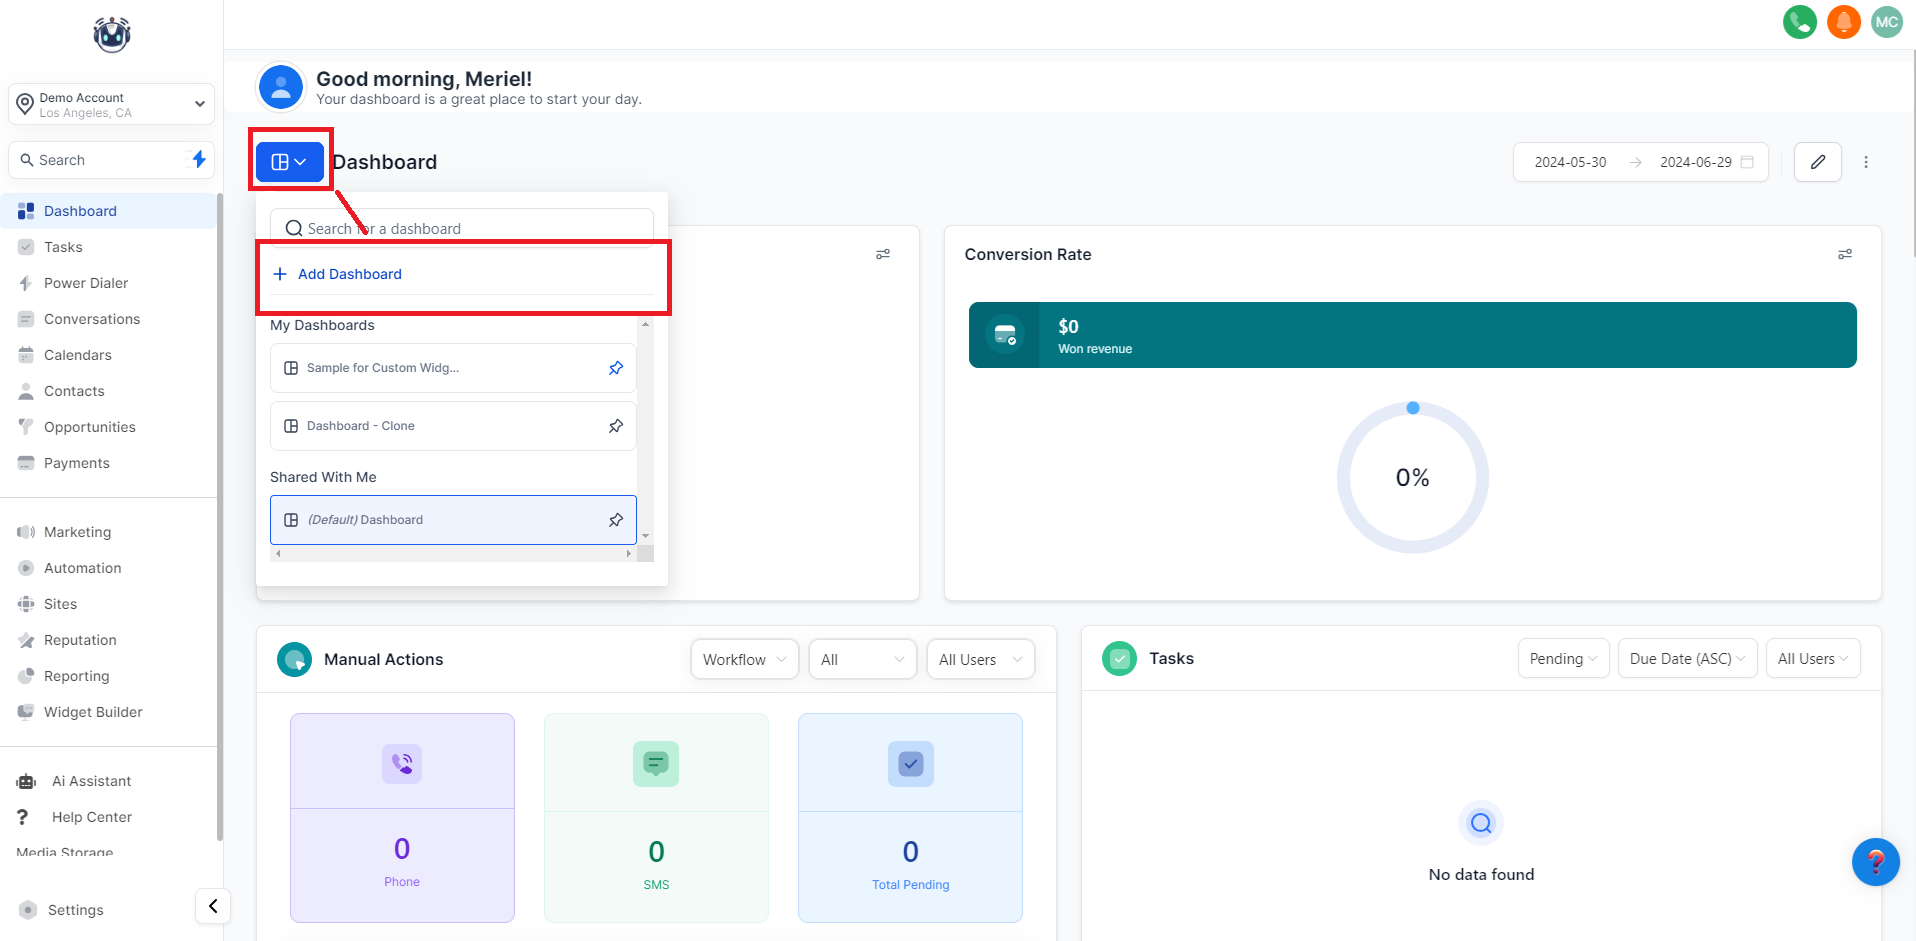
Users can create new dashboards to curate data and insights according to their specific needs. This functionality is available to users on the $497 and higher plans, including both Agency and Account users.
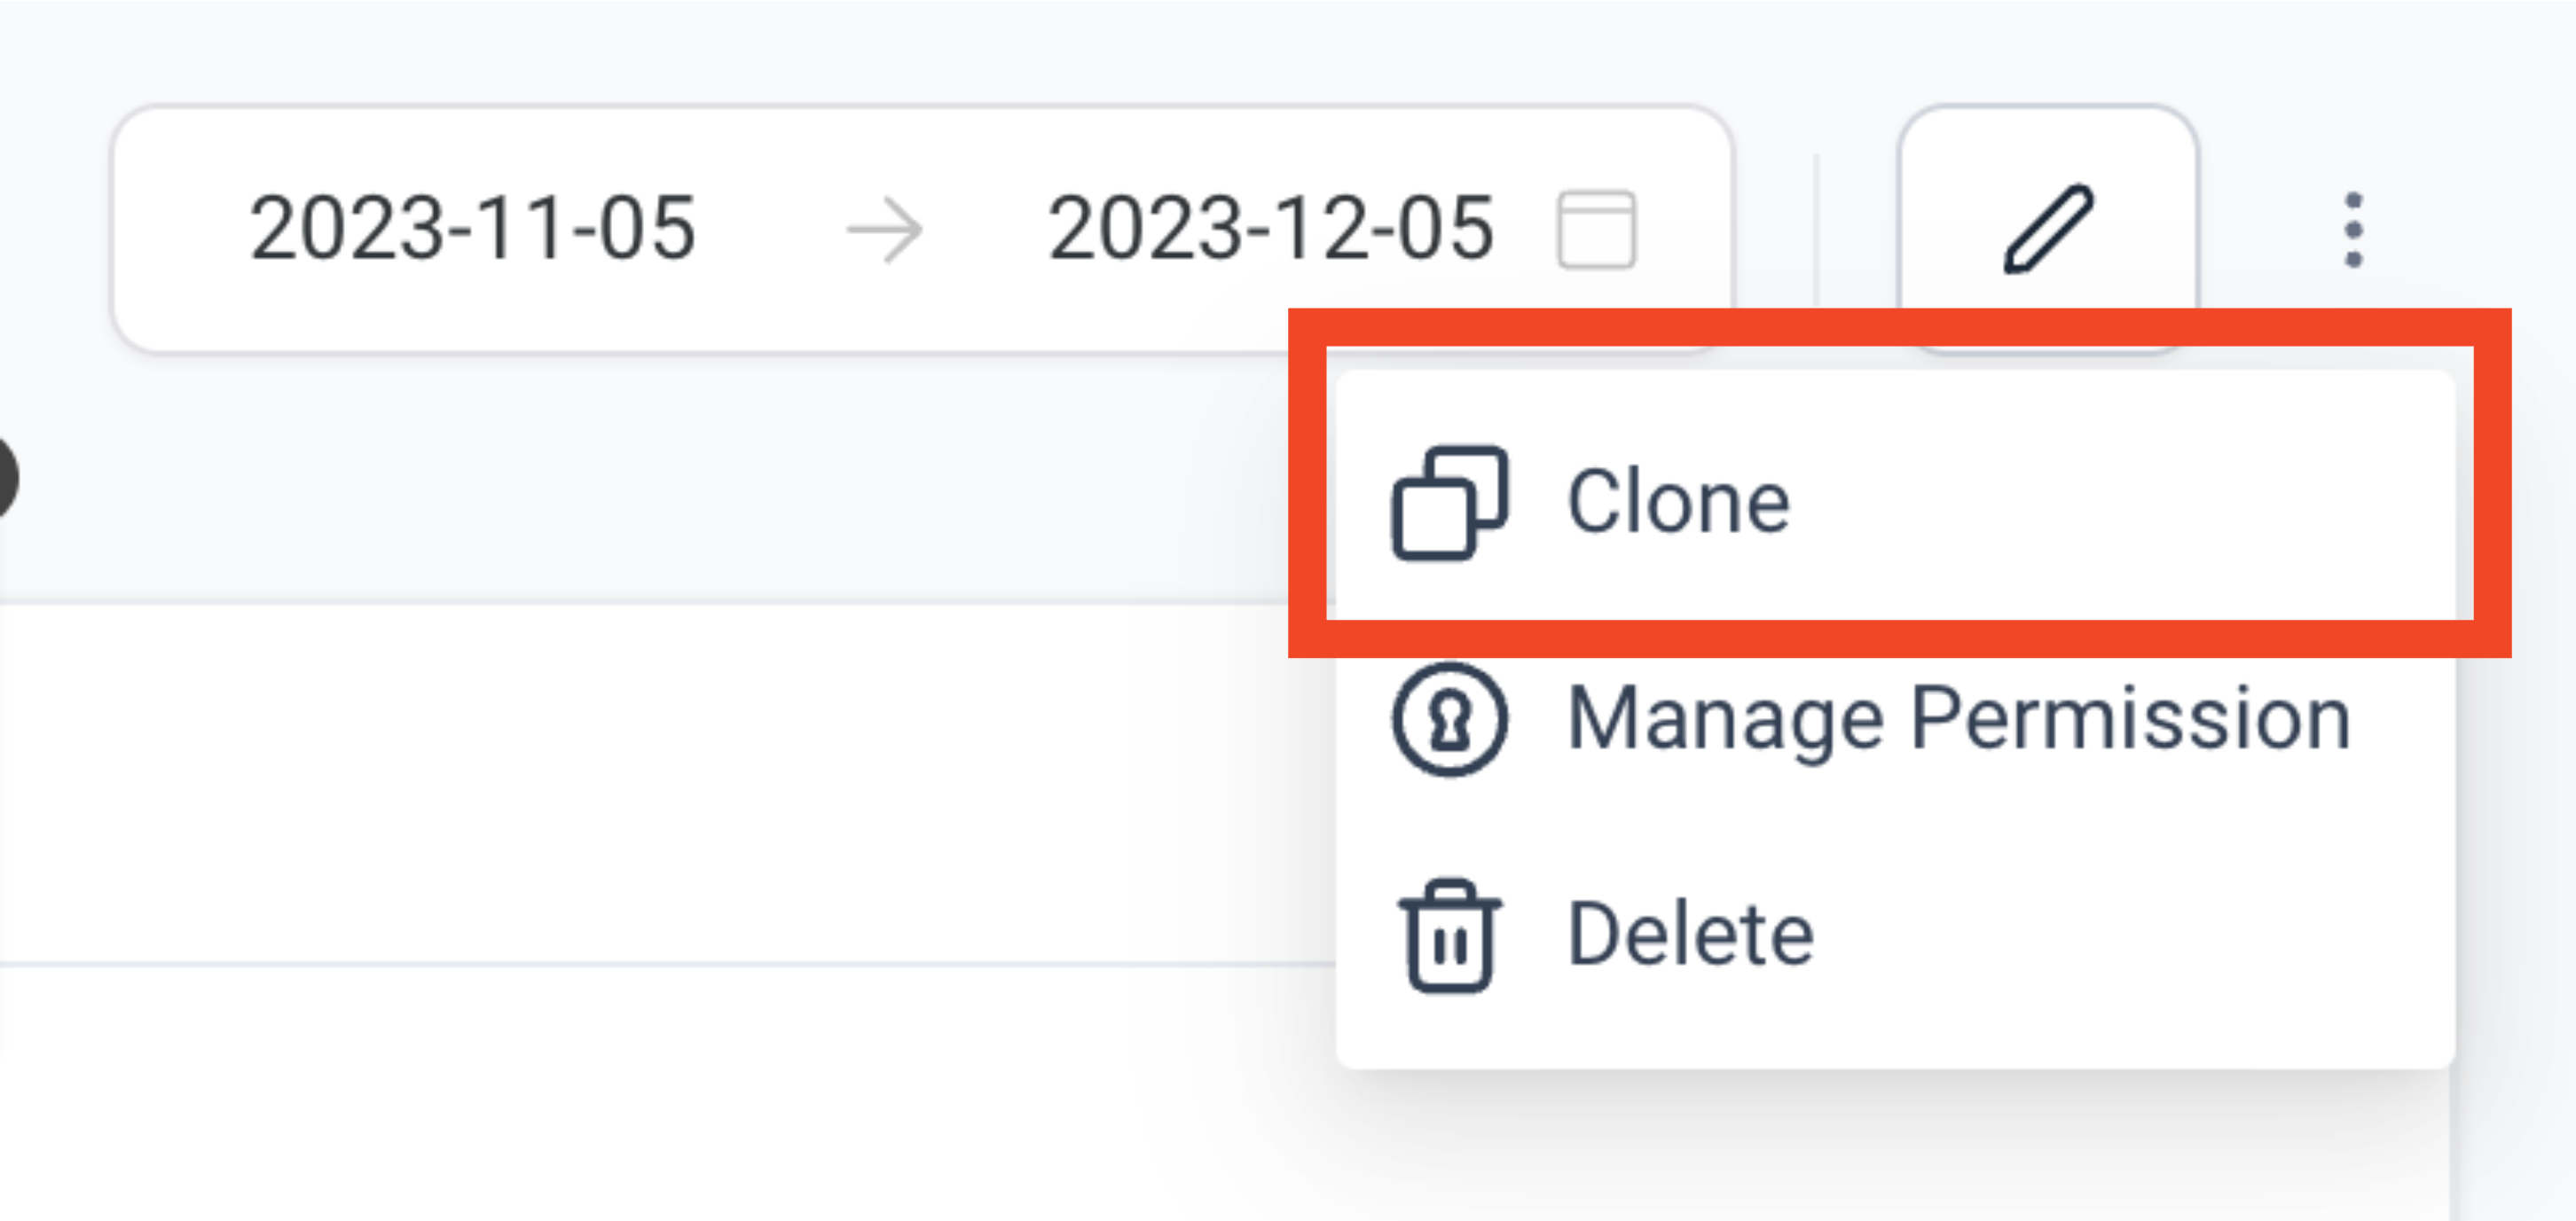
This feature allows users to duplicate existing dashboards, making quick modifications and minimizing repetitive setup. Both users with Full and View-only access can clone an existing dashboard.
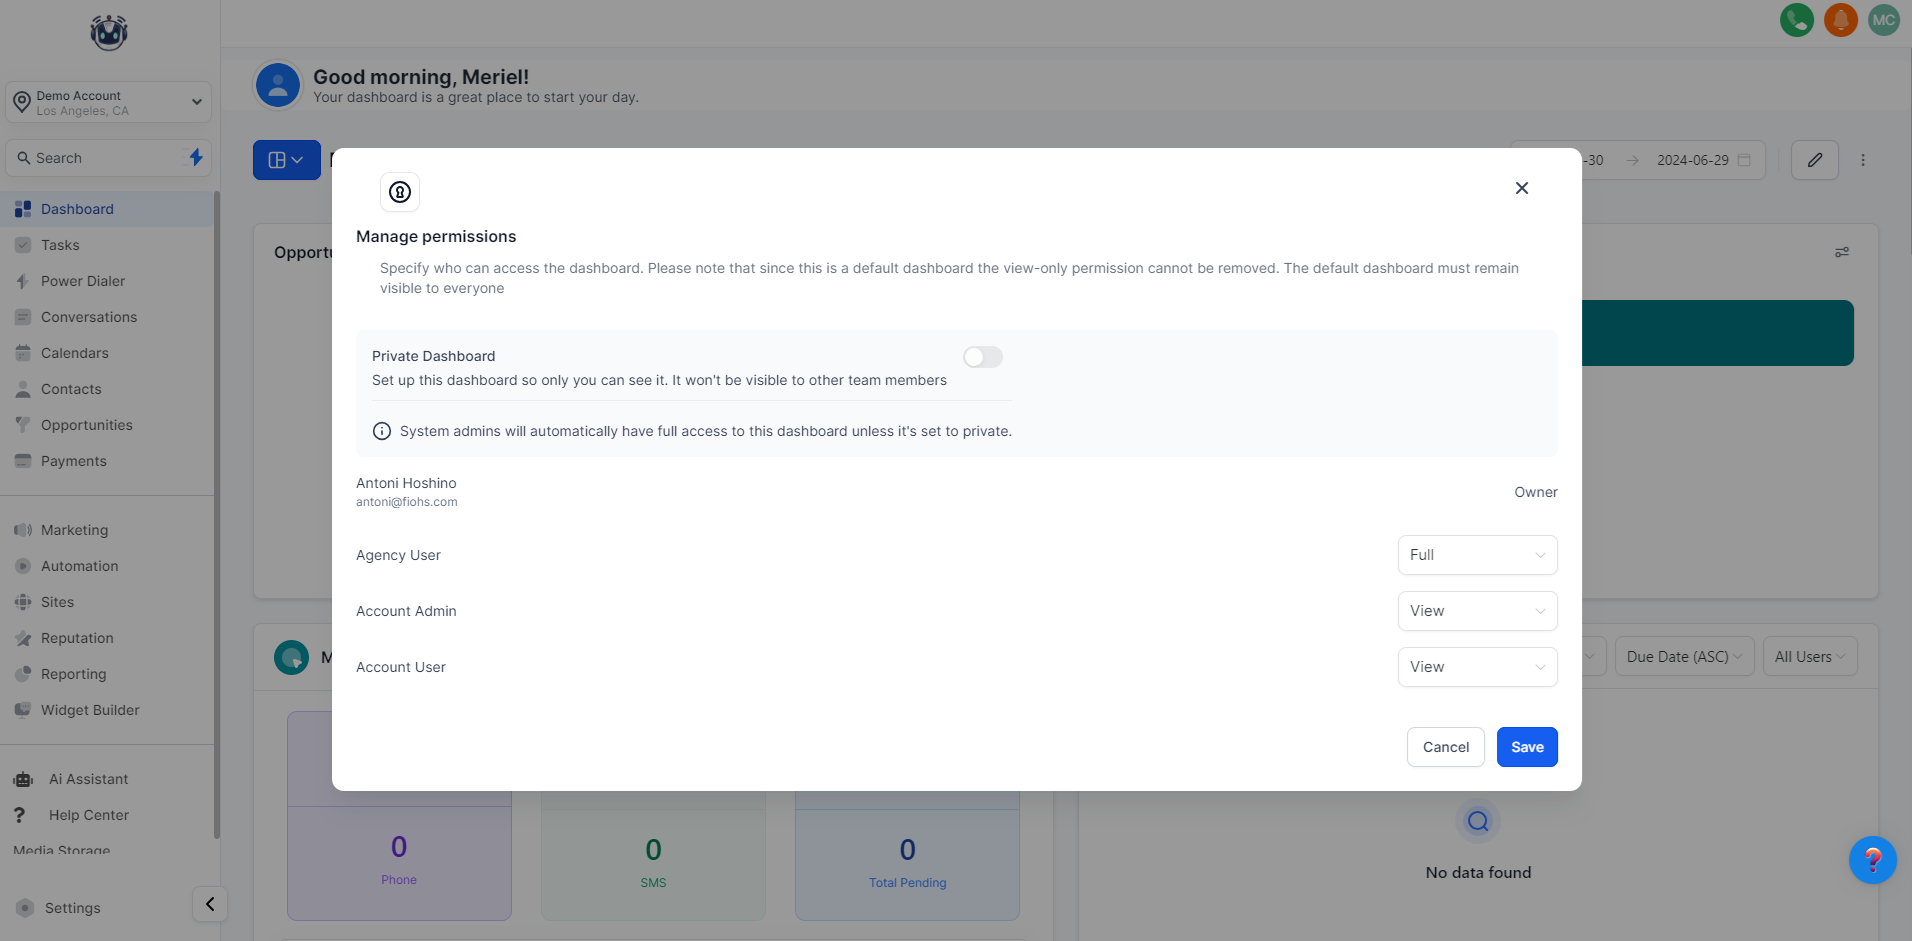
Owners and users with FULL access to a dashboard can manage permissions for different roles. Dashboards can also be set as Private, making them invisible to other team members.
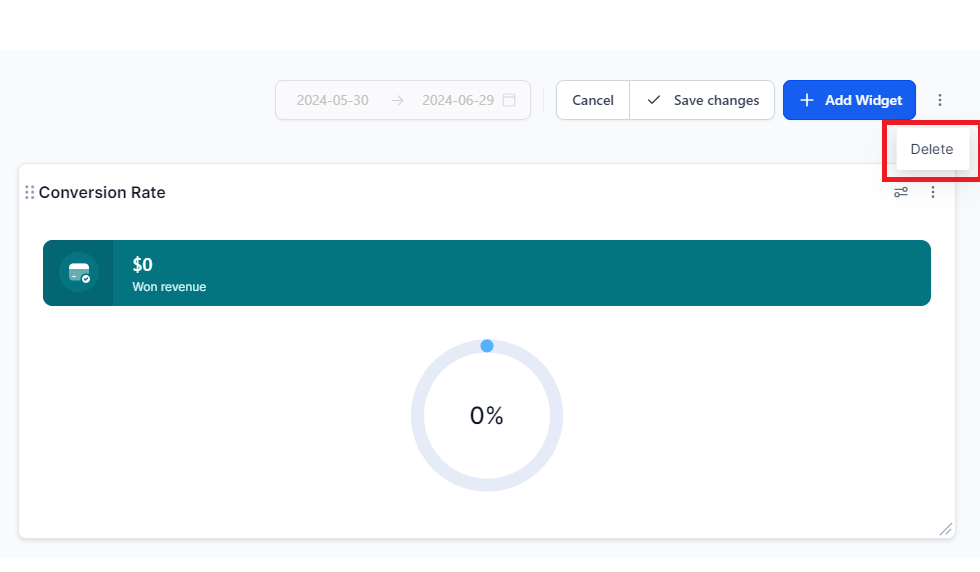
Dashboard owners can remove dashboards they no longer need, decluttering their workspace.
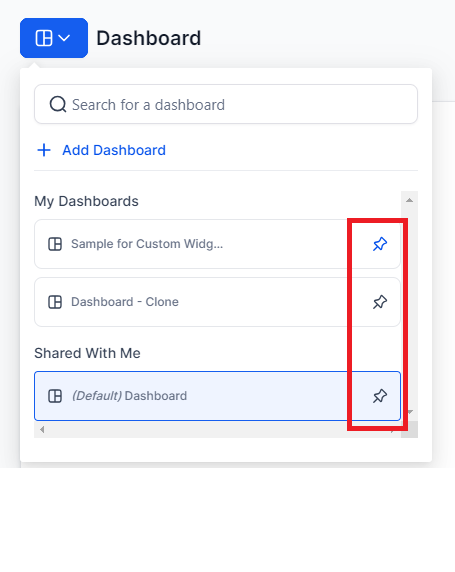
Users can prioritize important dashboards by pinning them for quick and easy access.
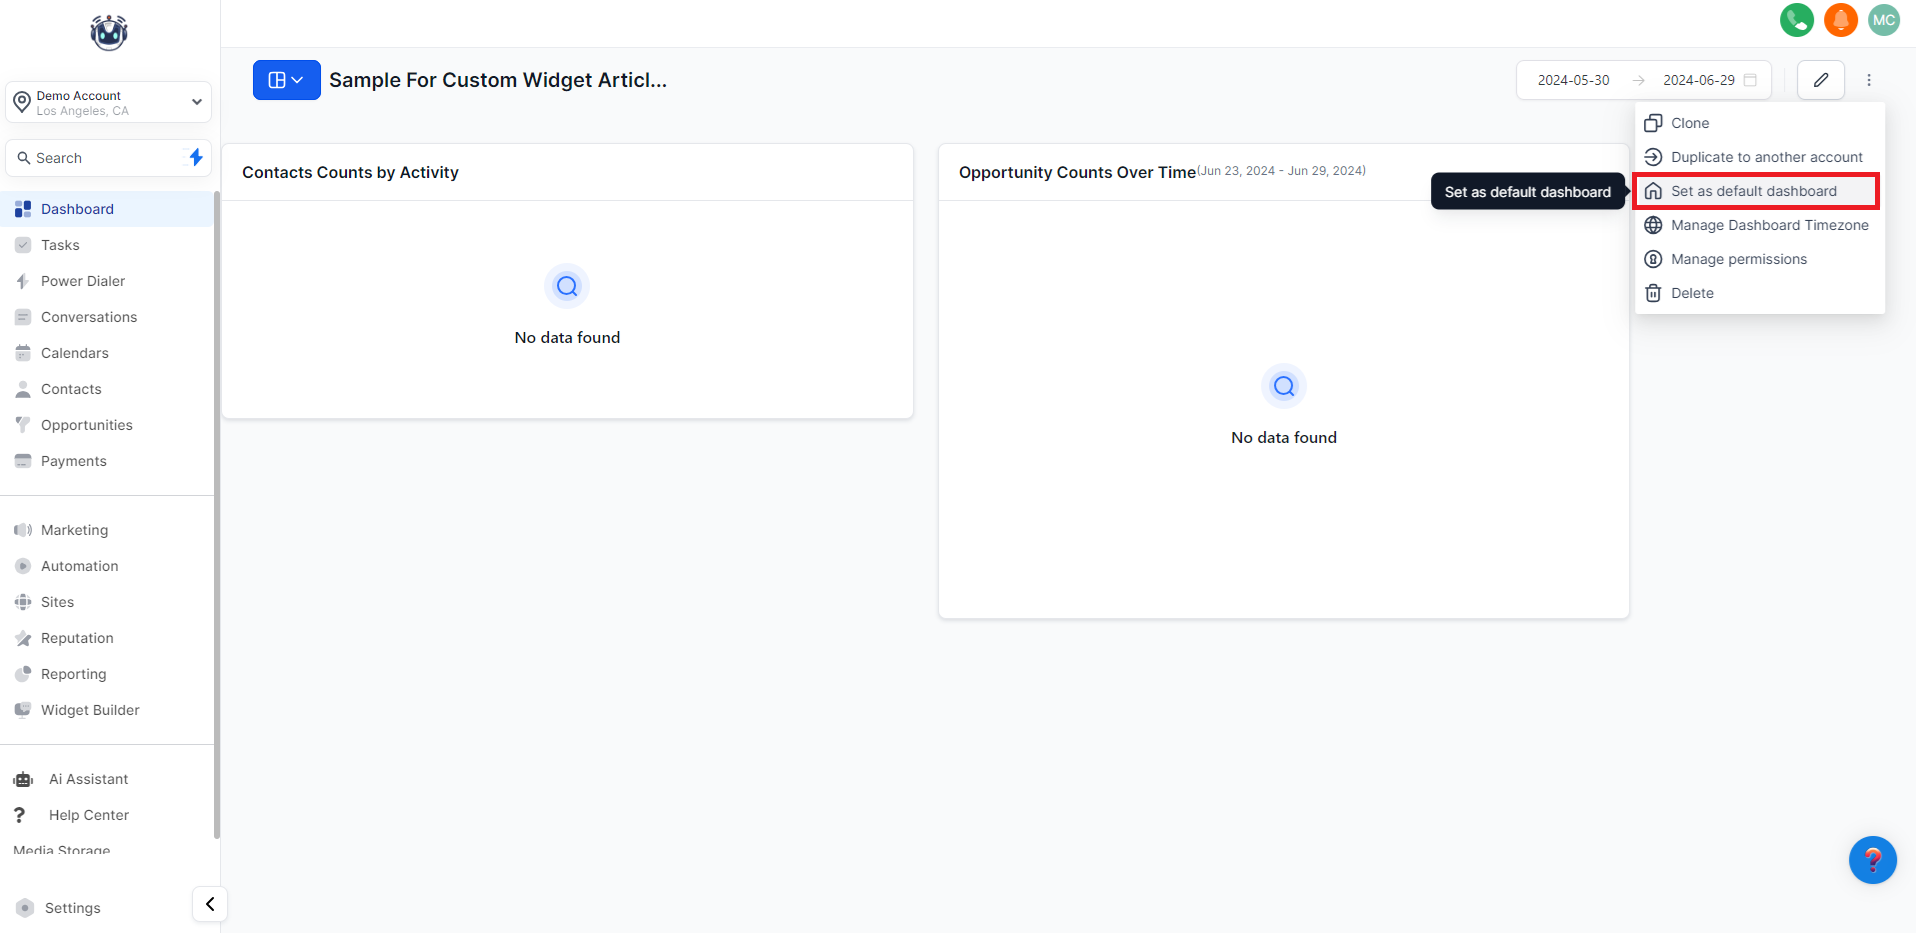
Users can set a Default Dashboard to ensure that everyone starts their day with the most critical information at their fingertips. Default dashboards serve as the primary landing page for all users, while pinned dashboards are personal favorites that individual users can access quickly.
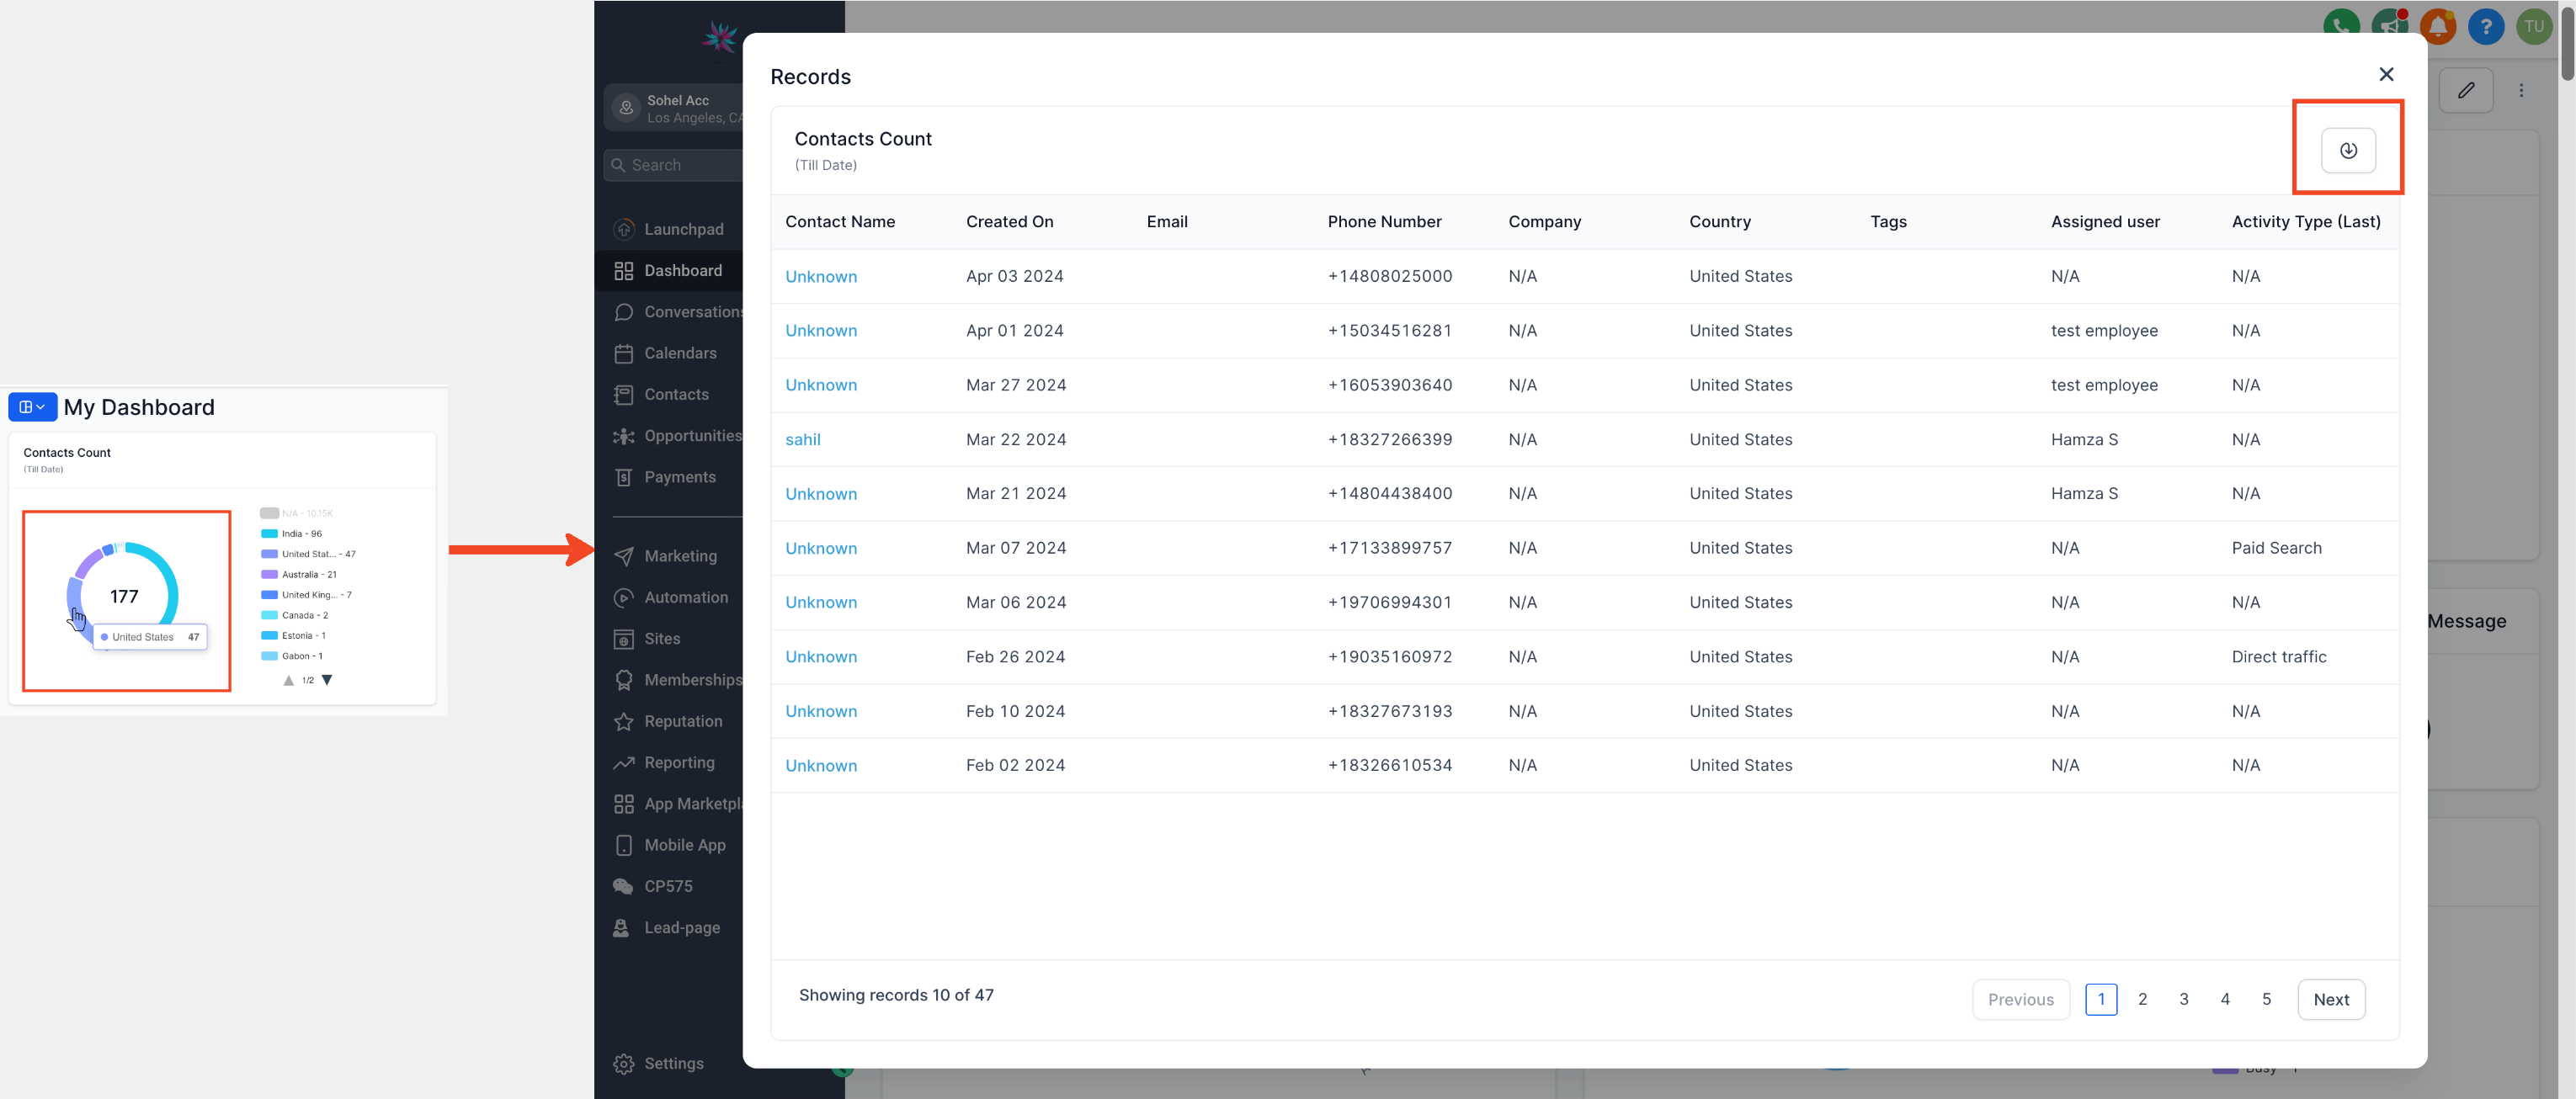
Users can view records and granular details for all charts and widgets by clicking on any component, such as a node on a line graph or a bar in a bar graph, unlocking a wealth of data. Records can also be downloaded by clicking the export icon on the record view pop-up.
Records can be downloaded by clicking the export icon on the record view pop-up for widgets. For Table widgets, the export icon is present on the widget itself.
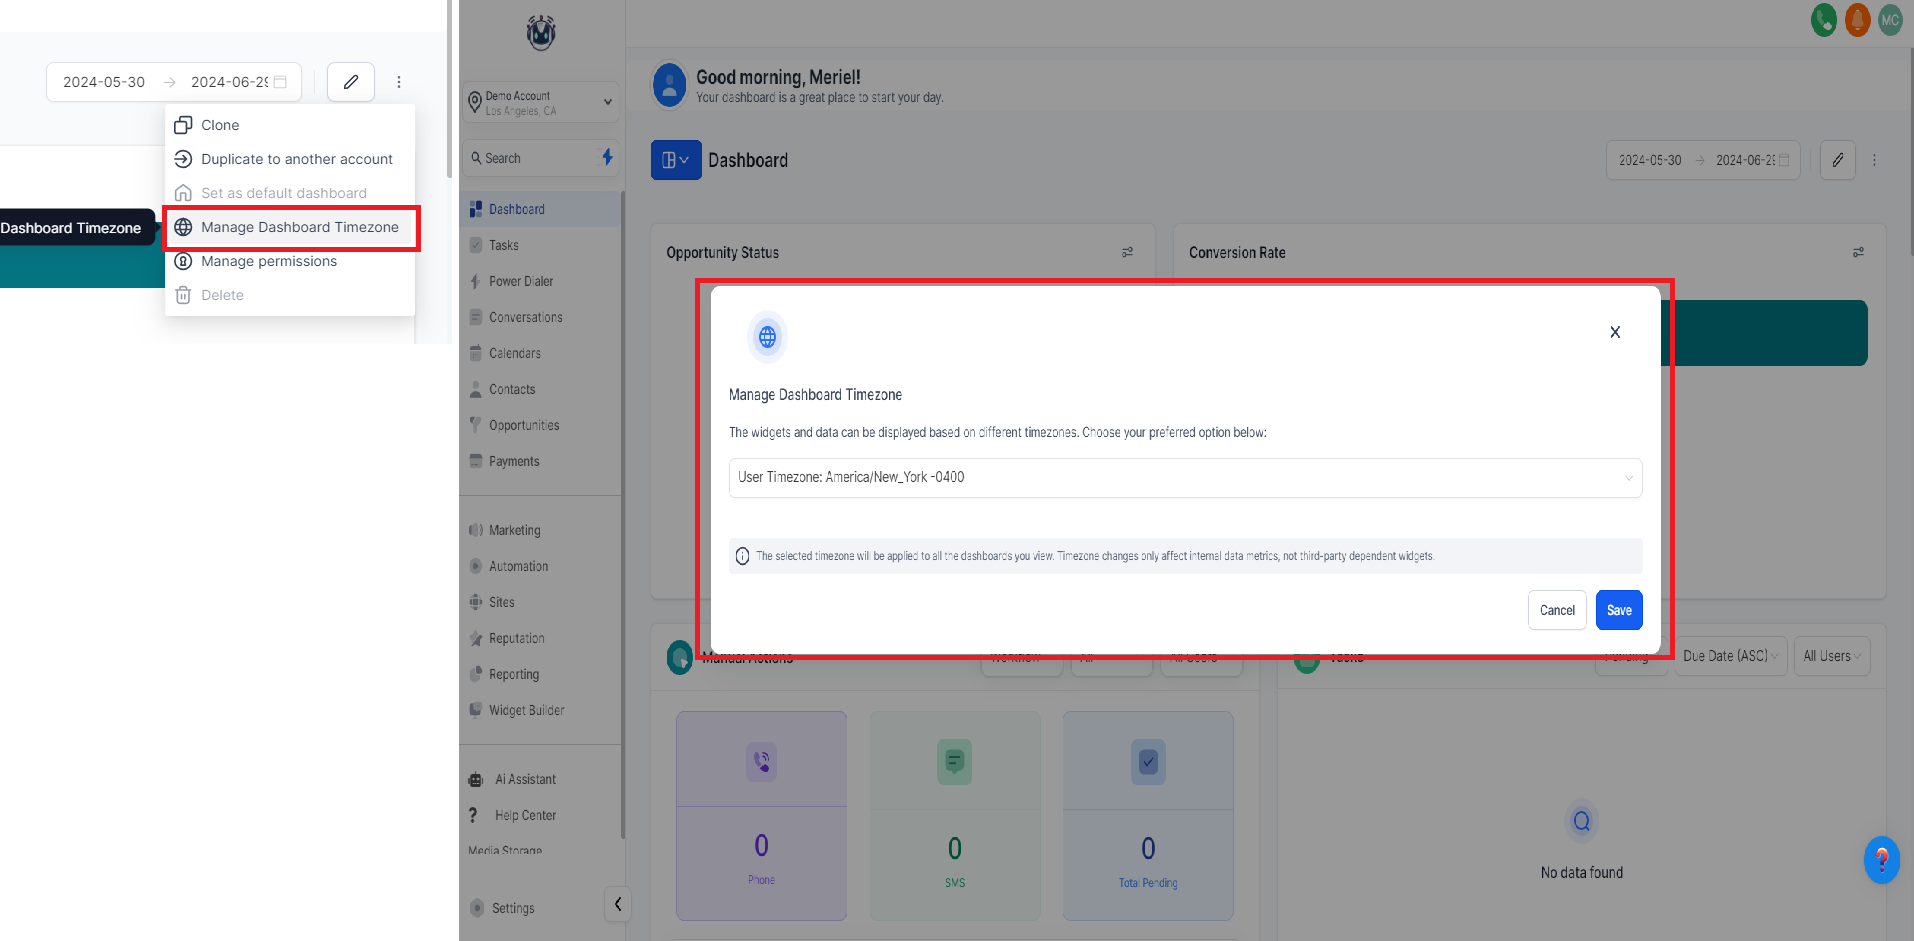
Previously, data mismatches between dashboard widgets and other platform modules caused confusion due to differing time zones. This feature allows users to synchronize their dashboard data with their local time effortlessly, enhancing efficiency and accuracy, and providing the flexibility needed to optimize data analysis.