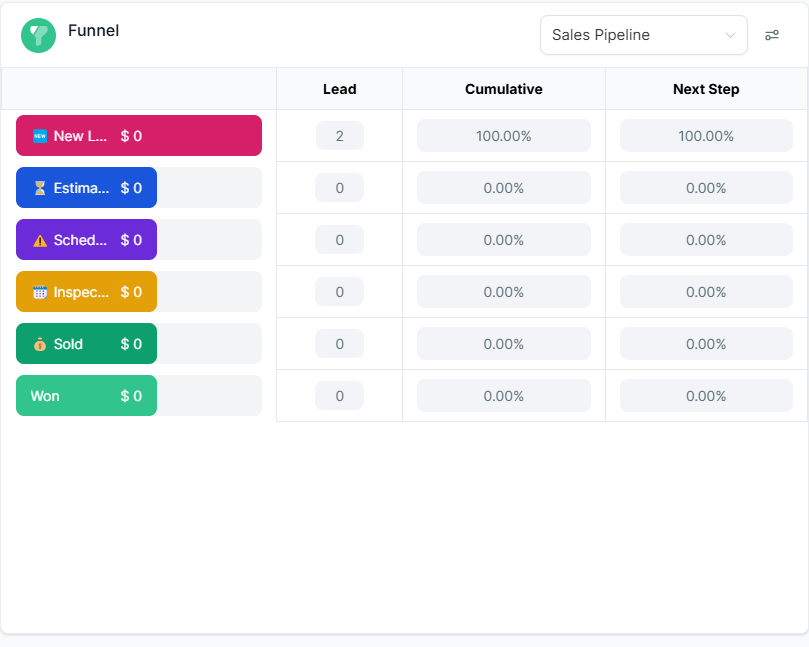
This chart assumes that each stage represents a single step closer to the goal. For instance, if an appointment has been set, the 'Funnel Chart' will categorize it as 'Leads'.
Funnel charts are used to visualize the progressive reduction of data as it moves through different stages in a process. They are particularly useful for identifying potential problem areas in a process, such as a sales pipeline or conversion process.
Stage distribution charts, on the other hand, provide a snapshot of how many items (such as leads, tasks, or projects) are currently at each stage of a process.
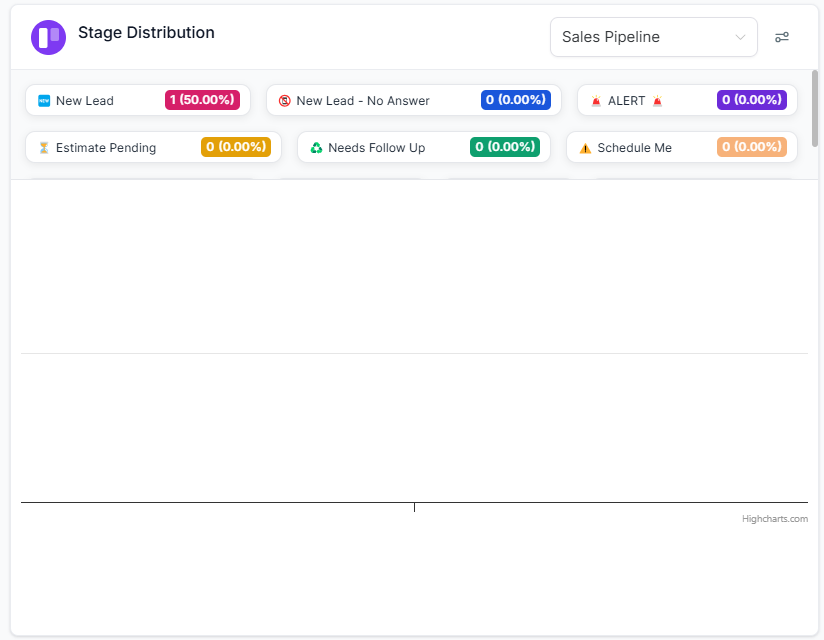
In summary, funnel charts are ideal for analyzing process efficiency and identifying areas for improvement, while stage distribution charts are better suited for monitoring the current state of a process and managing resources.