The Pest AI CRM Dashboard serves as the central hub for managing all your marketing and sales activities efficiently. It provides a comprehensive overview of real-time data across various widgets, enabling you to monitor opportunities, track performance metrics, and analyze actionable insights at a glance. Customize the dashboard to suit your specific business requirements by adding or removing widgets based on your needs.
This user-friendly interface is designed to streamline operations, enhance decision-making processes, and boost overall productivity by keeping all critical information accessible with minimal navigation. Whether monitoring campaign results, scheduling appointments, or reviewing sales funnels, the Pest AI CRM Dashboard equips you with the tools necessary for successful business management.
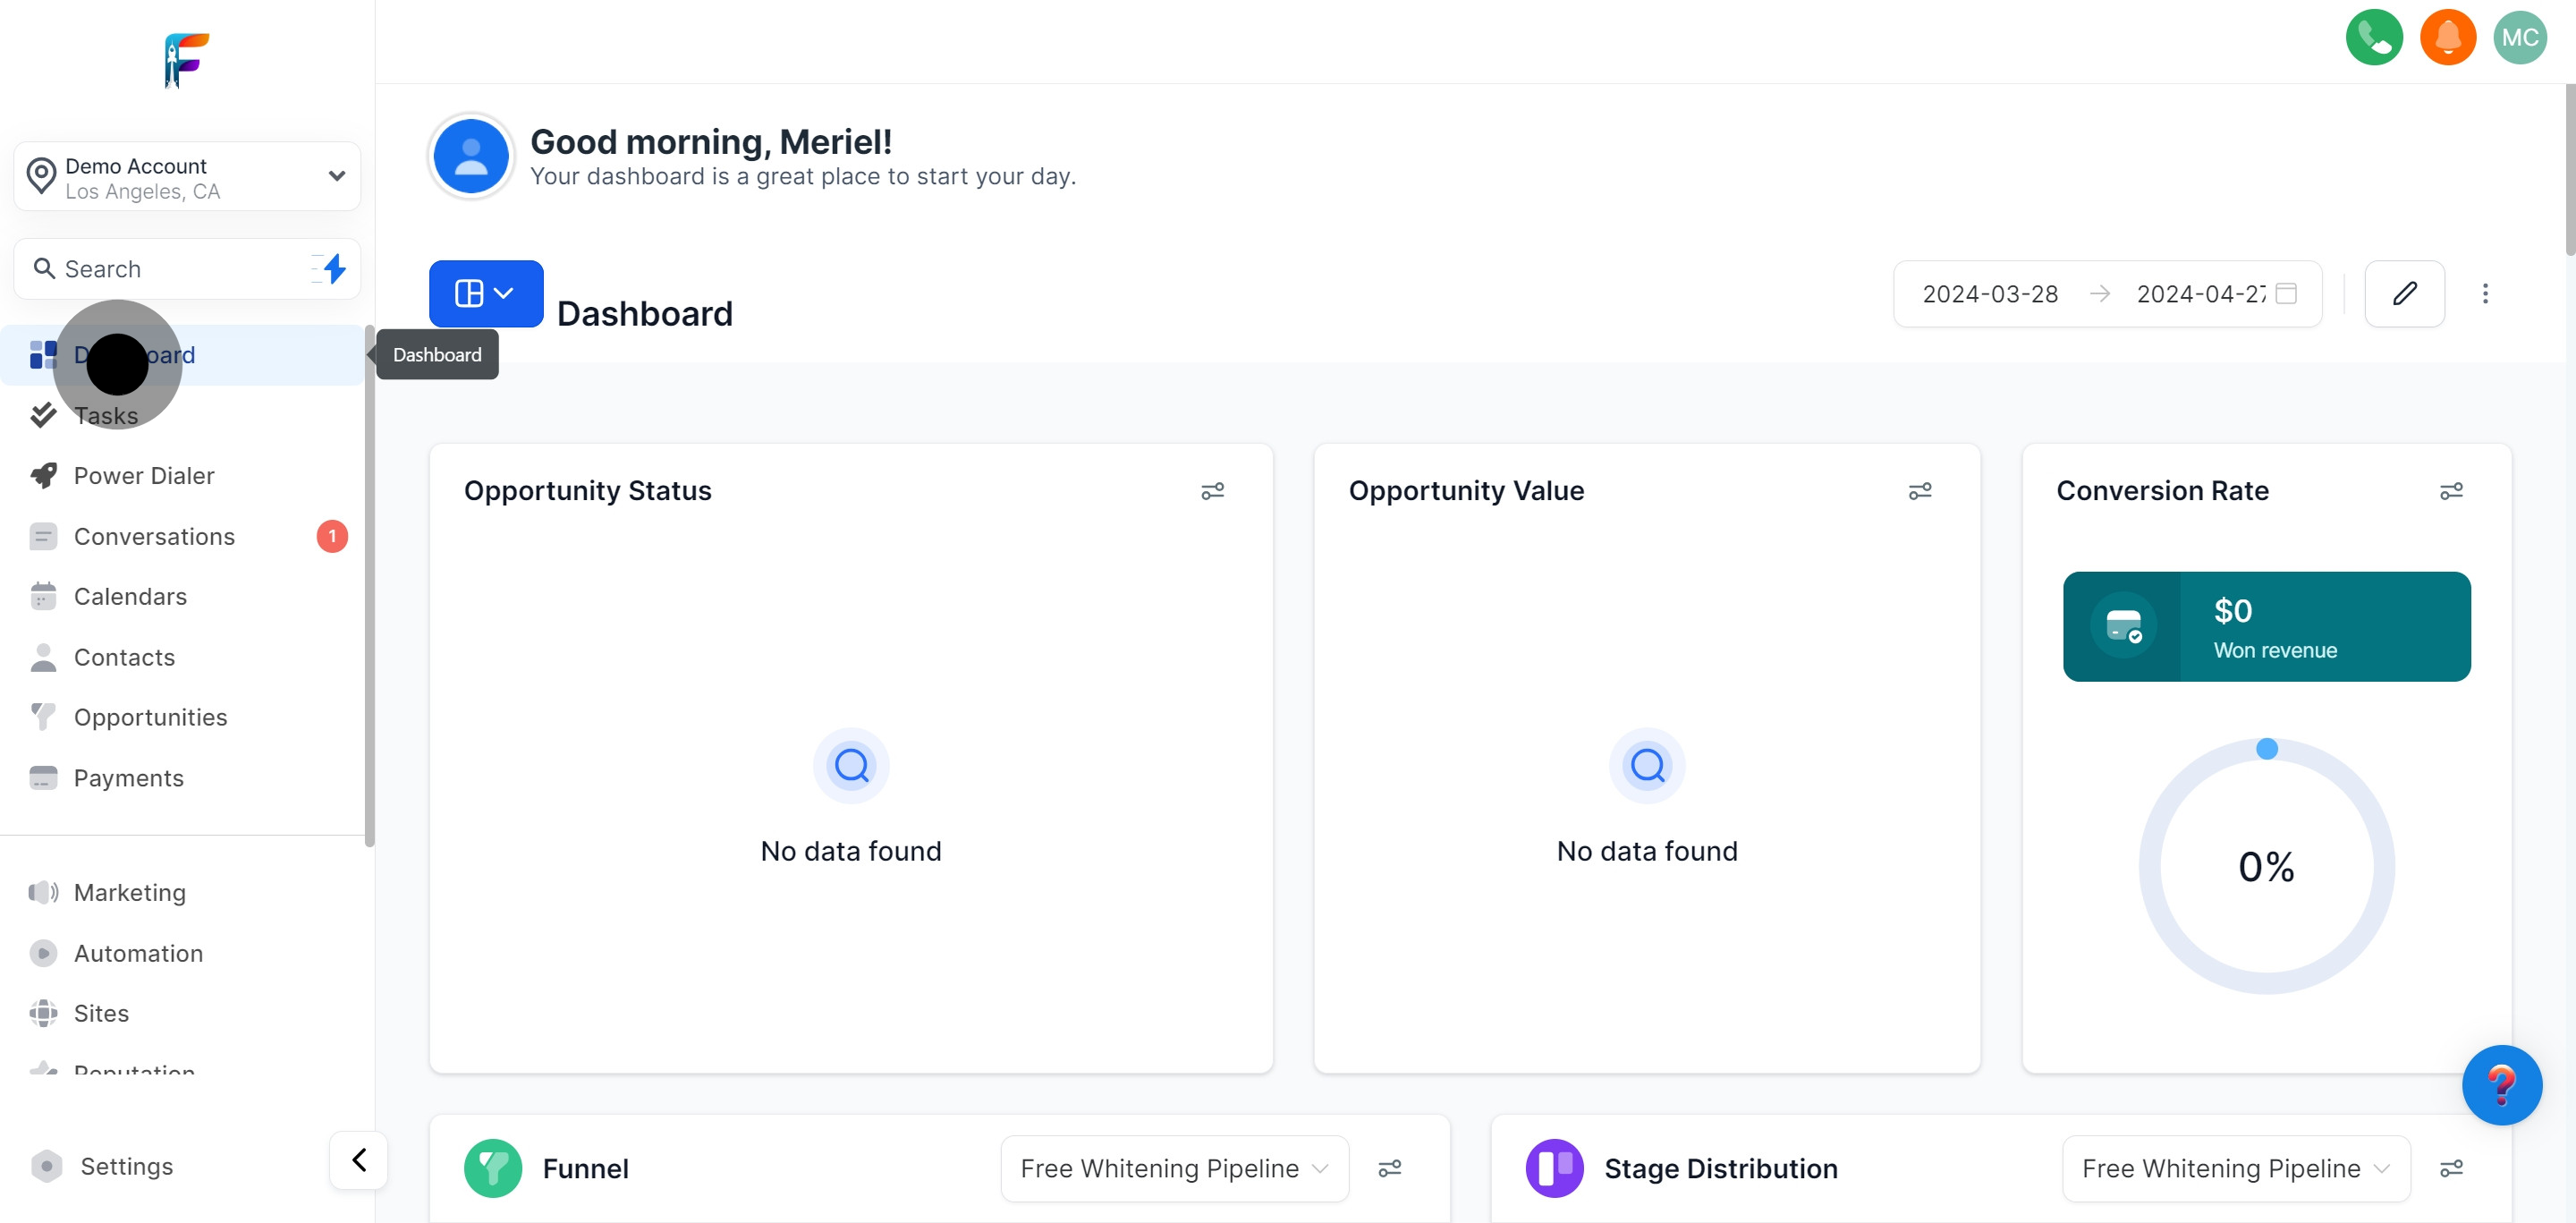
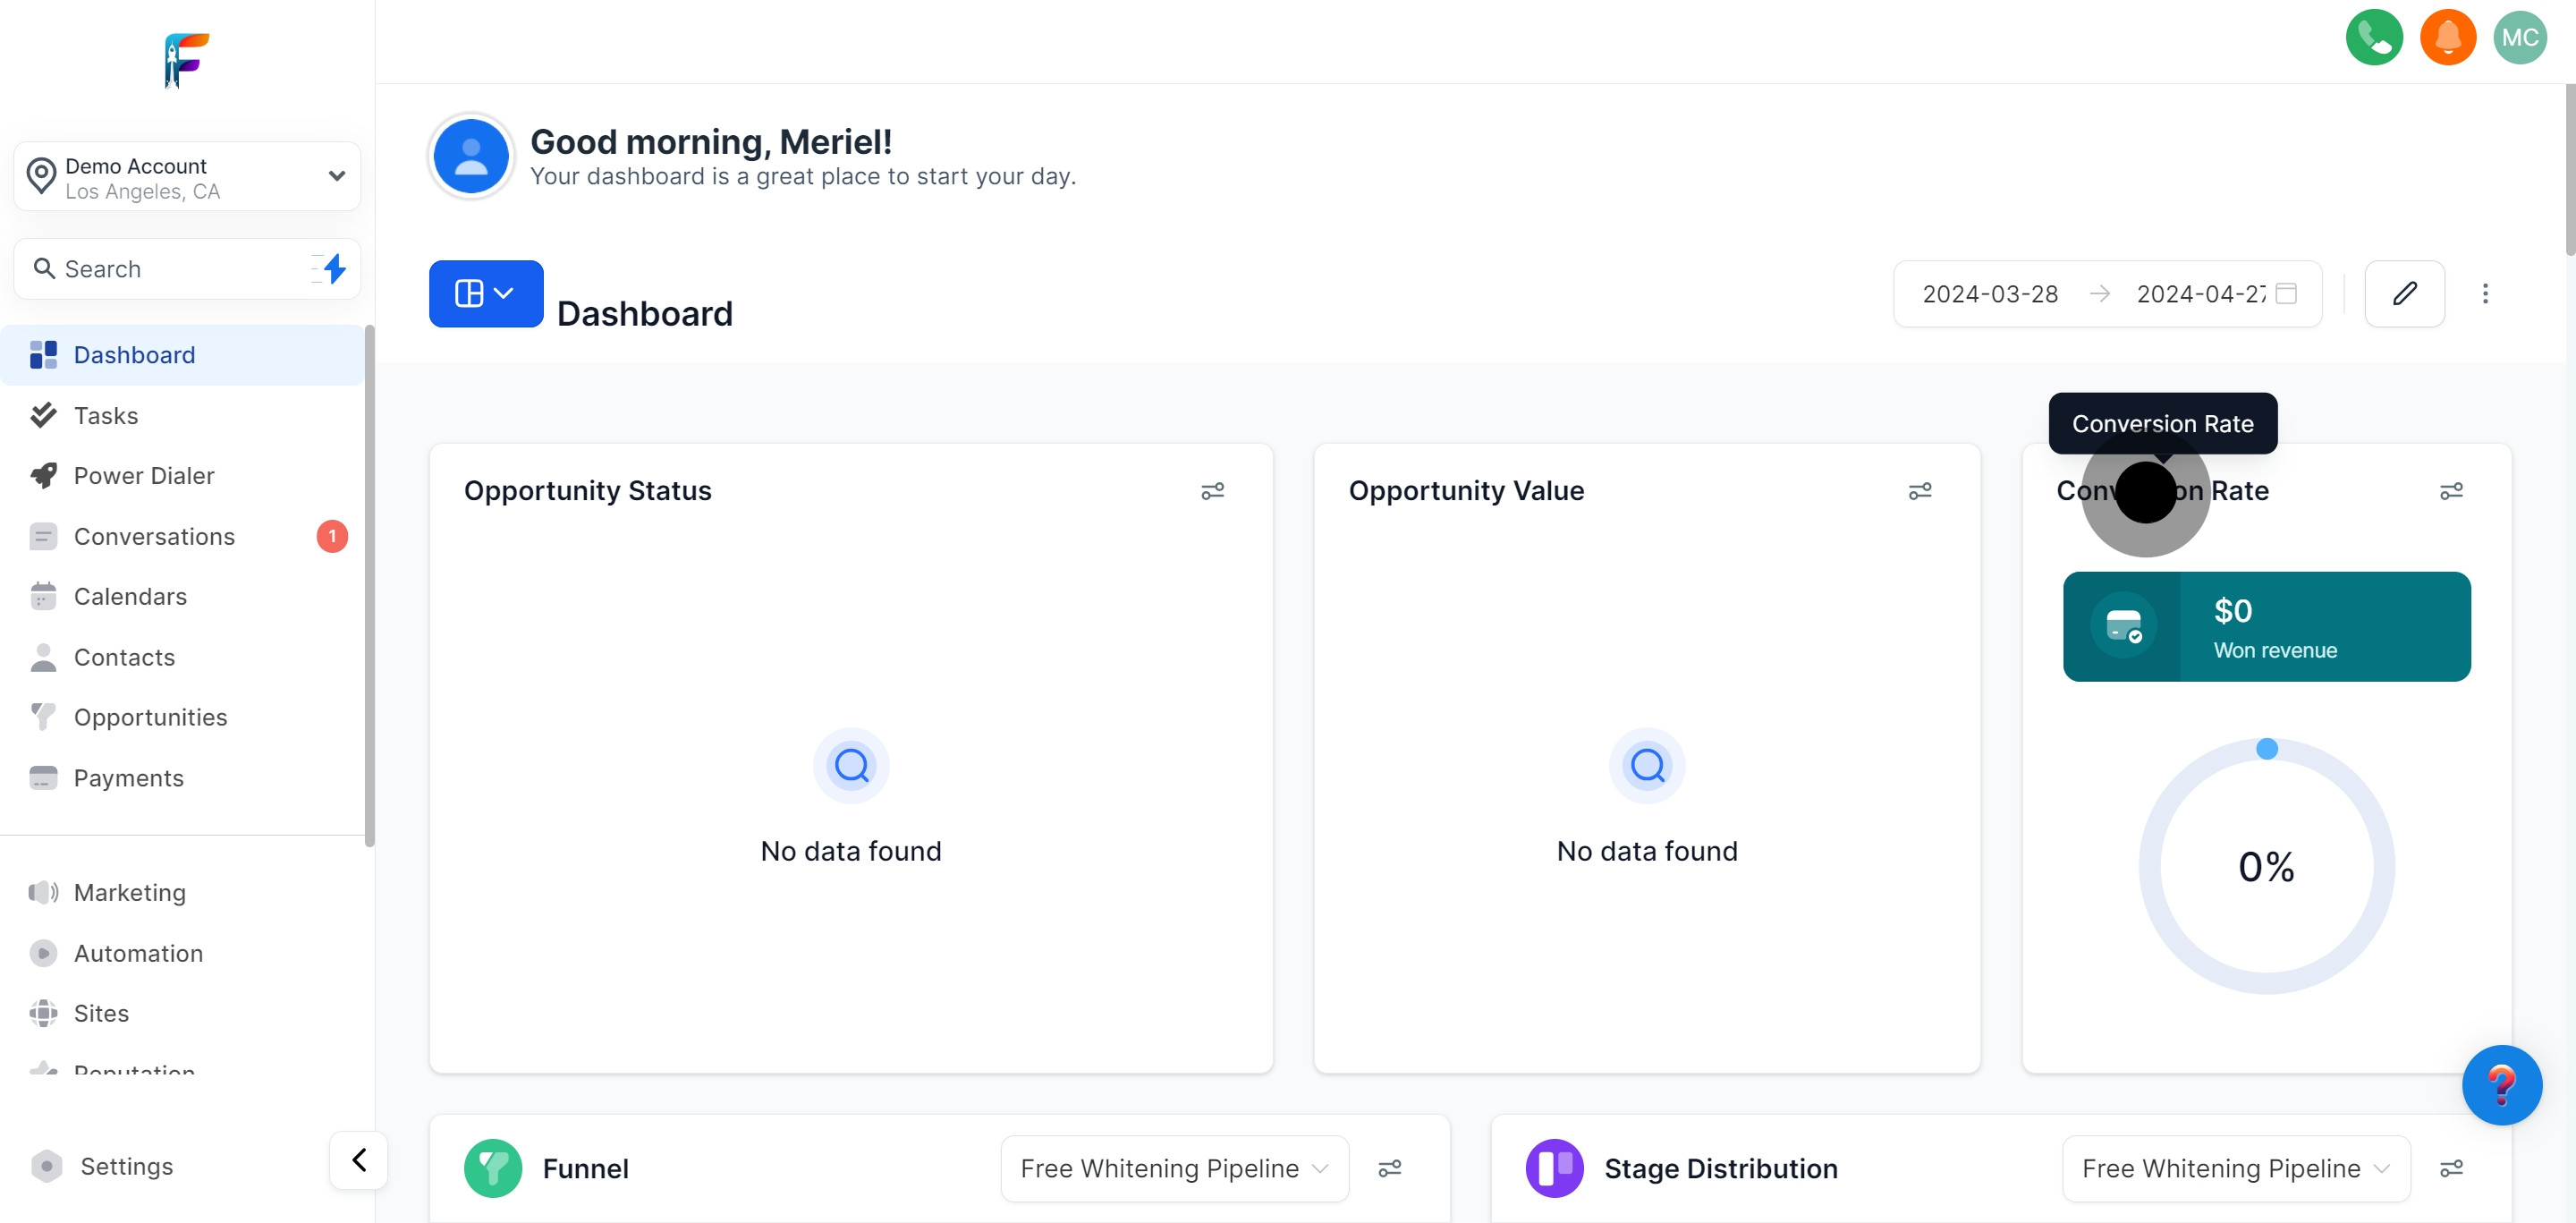
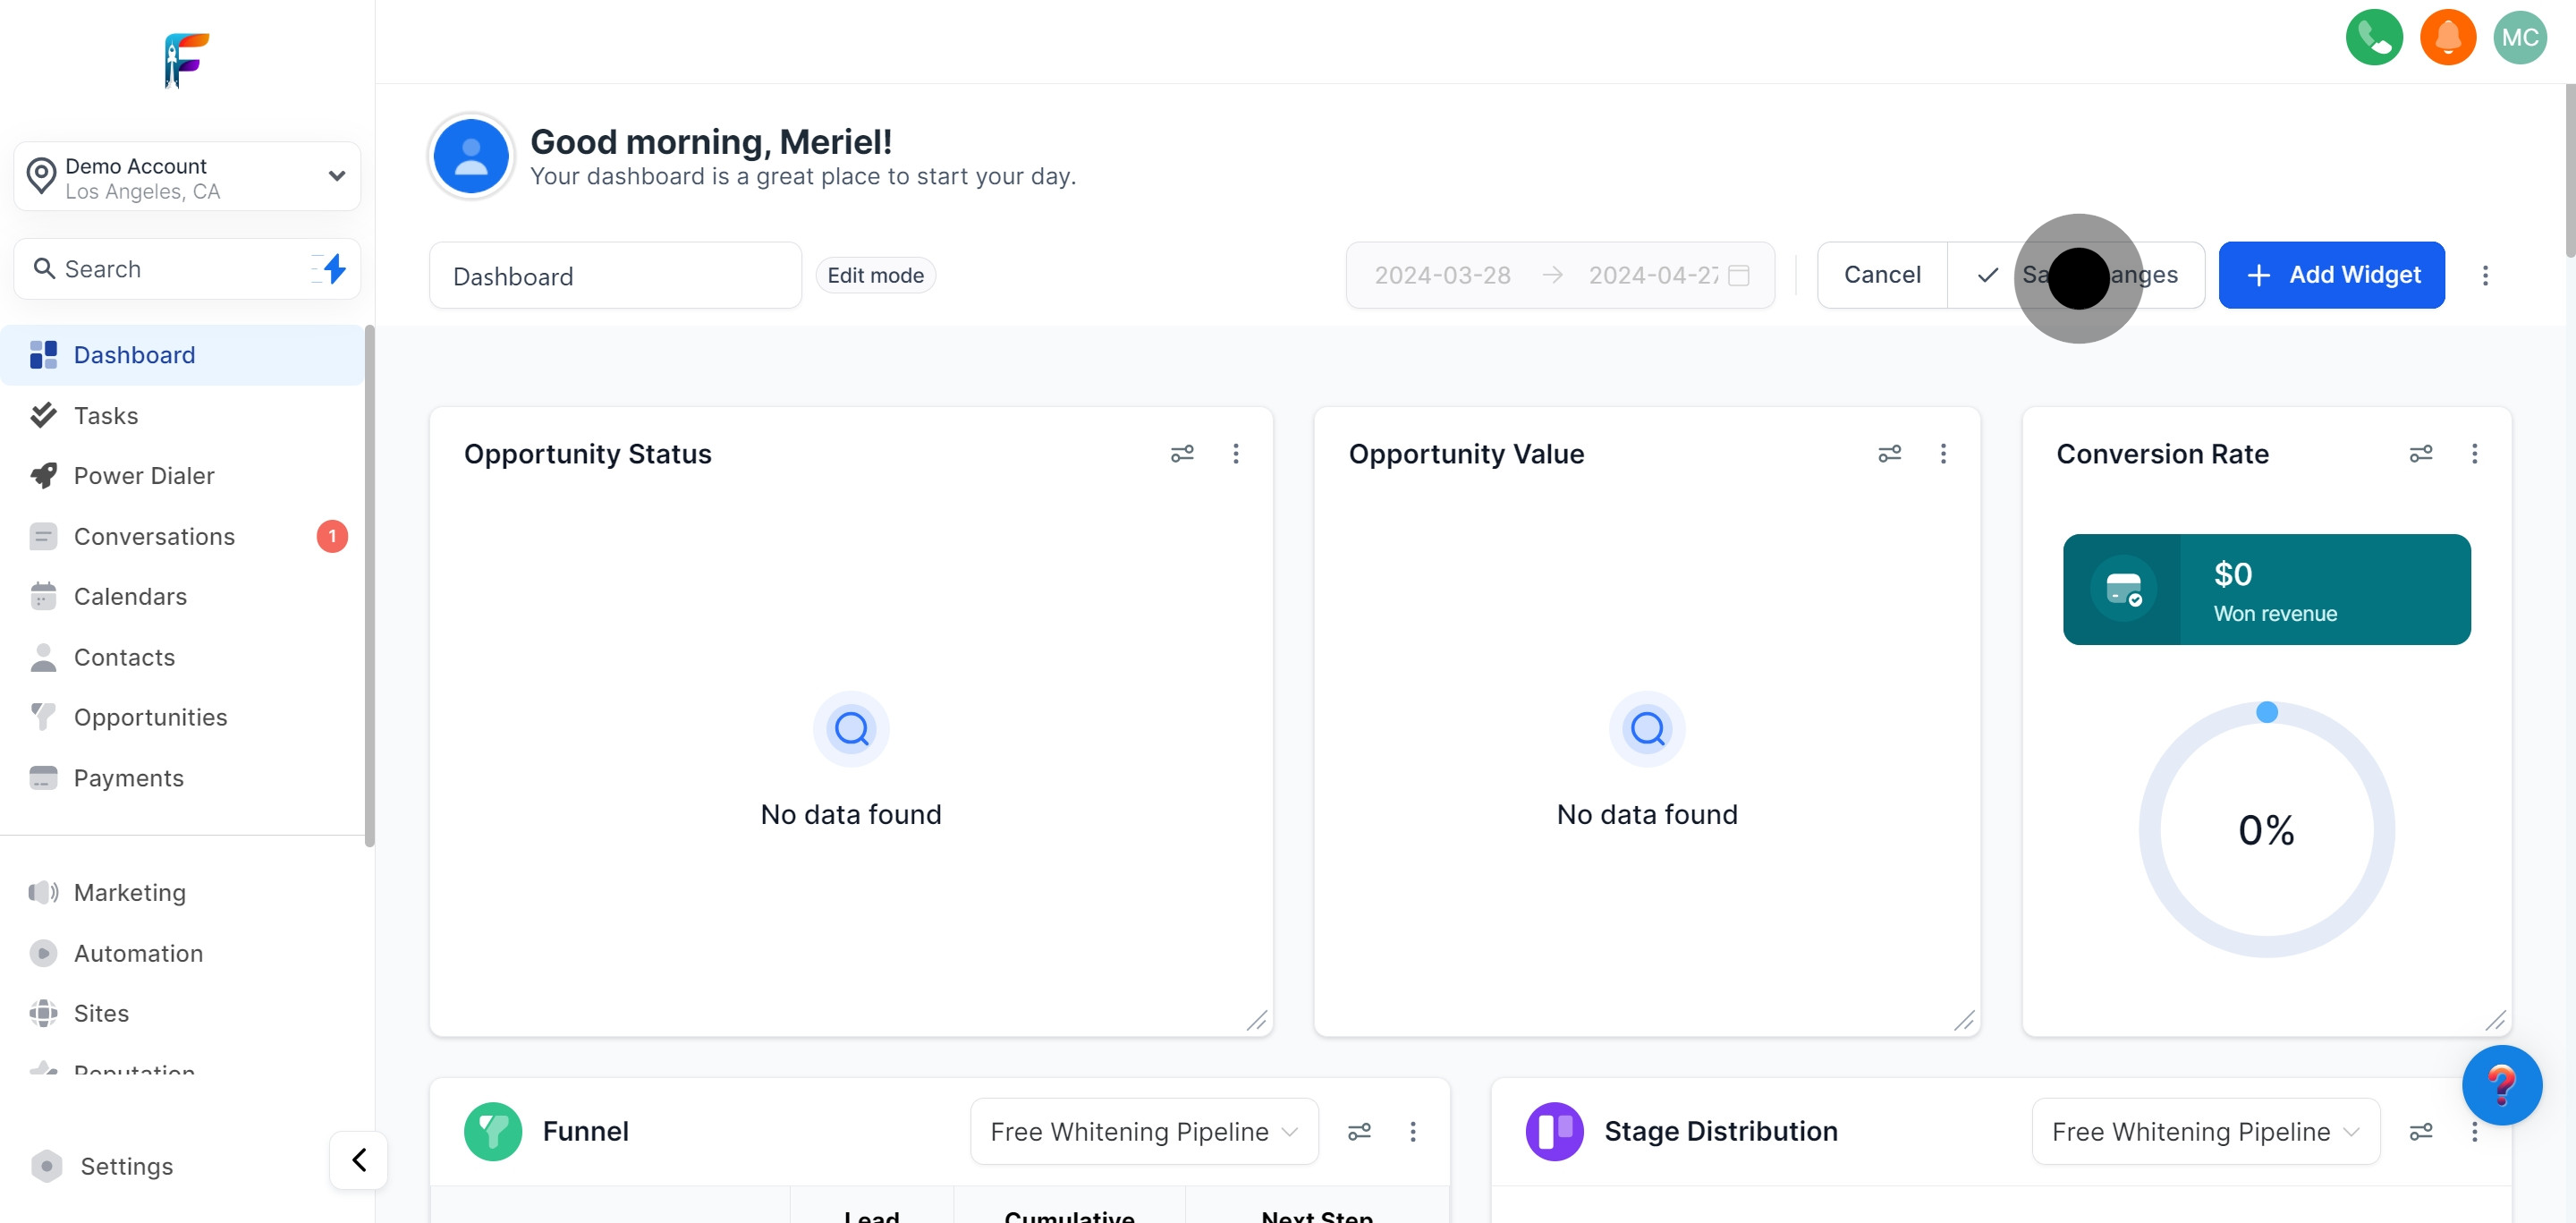
Start your experience by entering the main dashboard where all your critical widgets and reports are displayed.
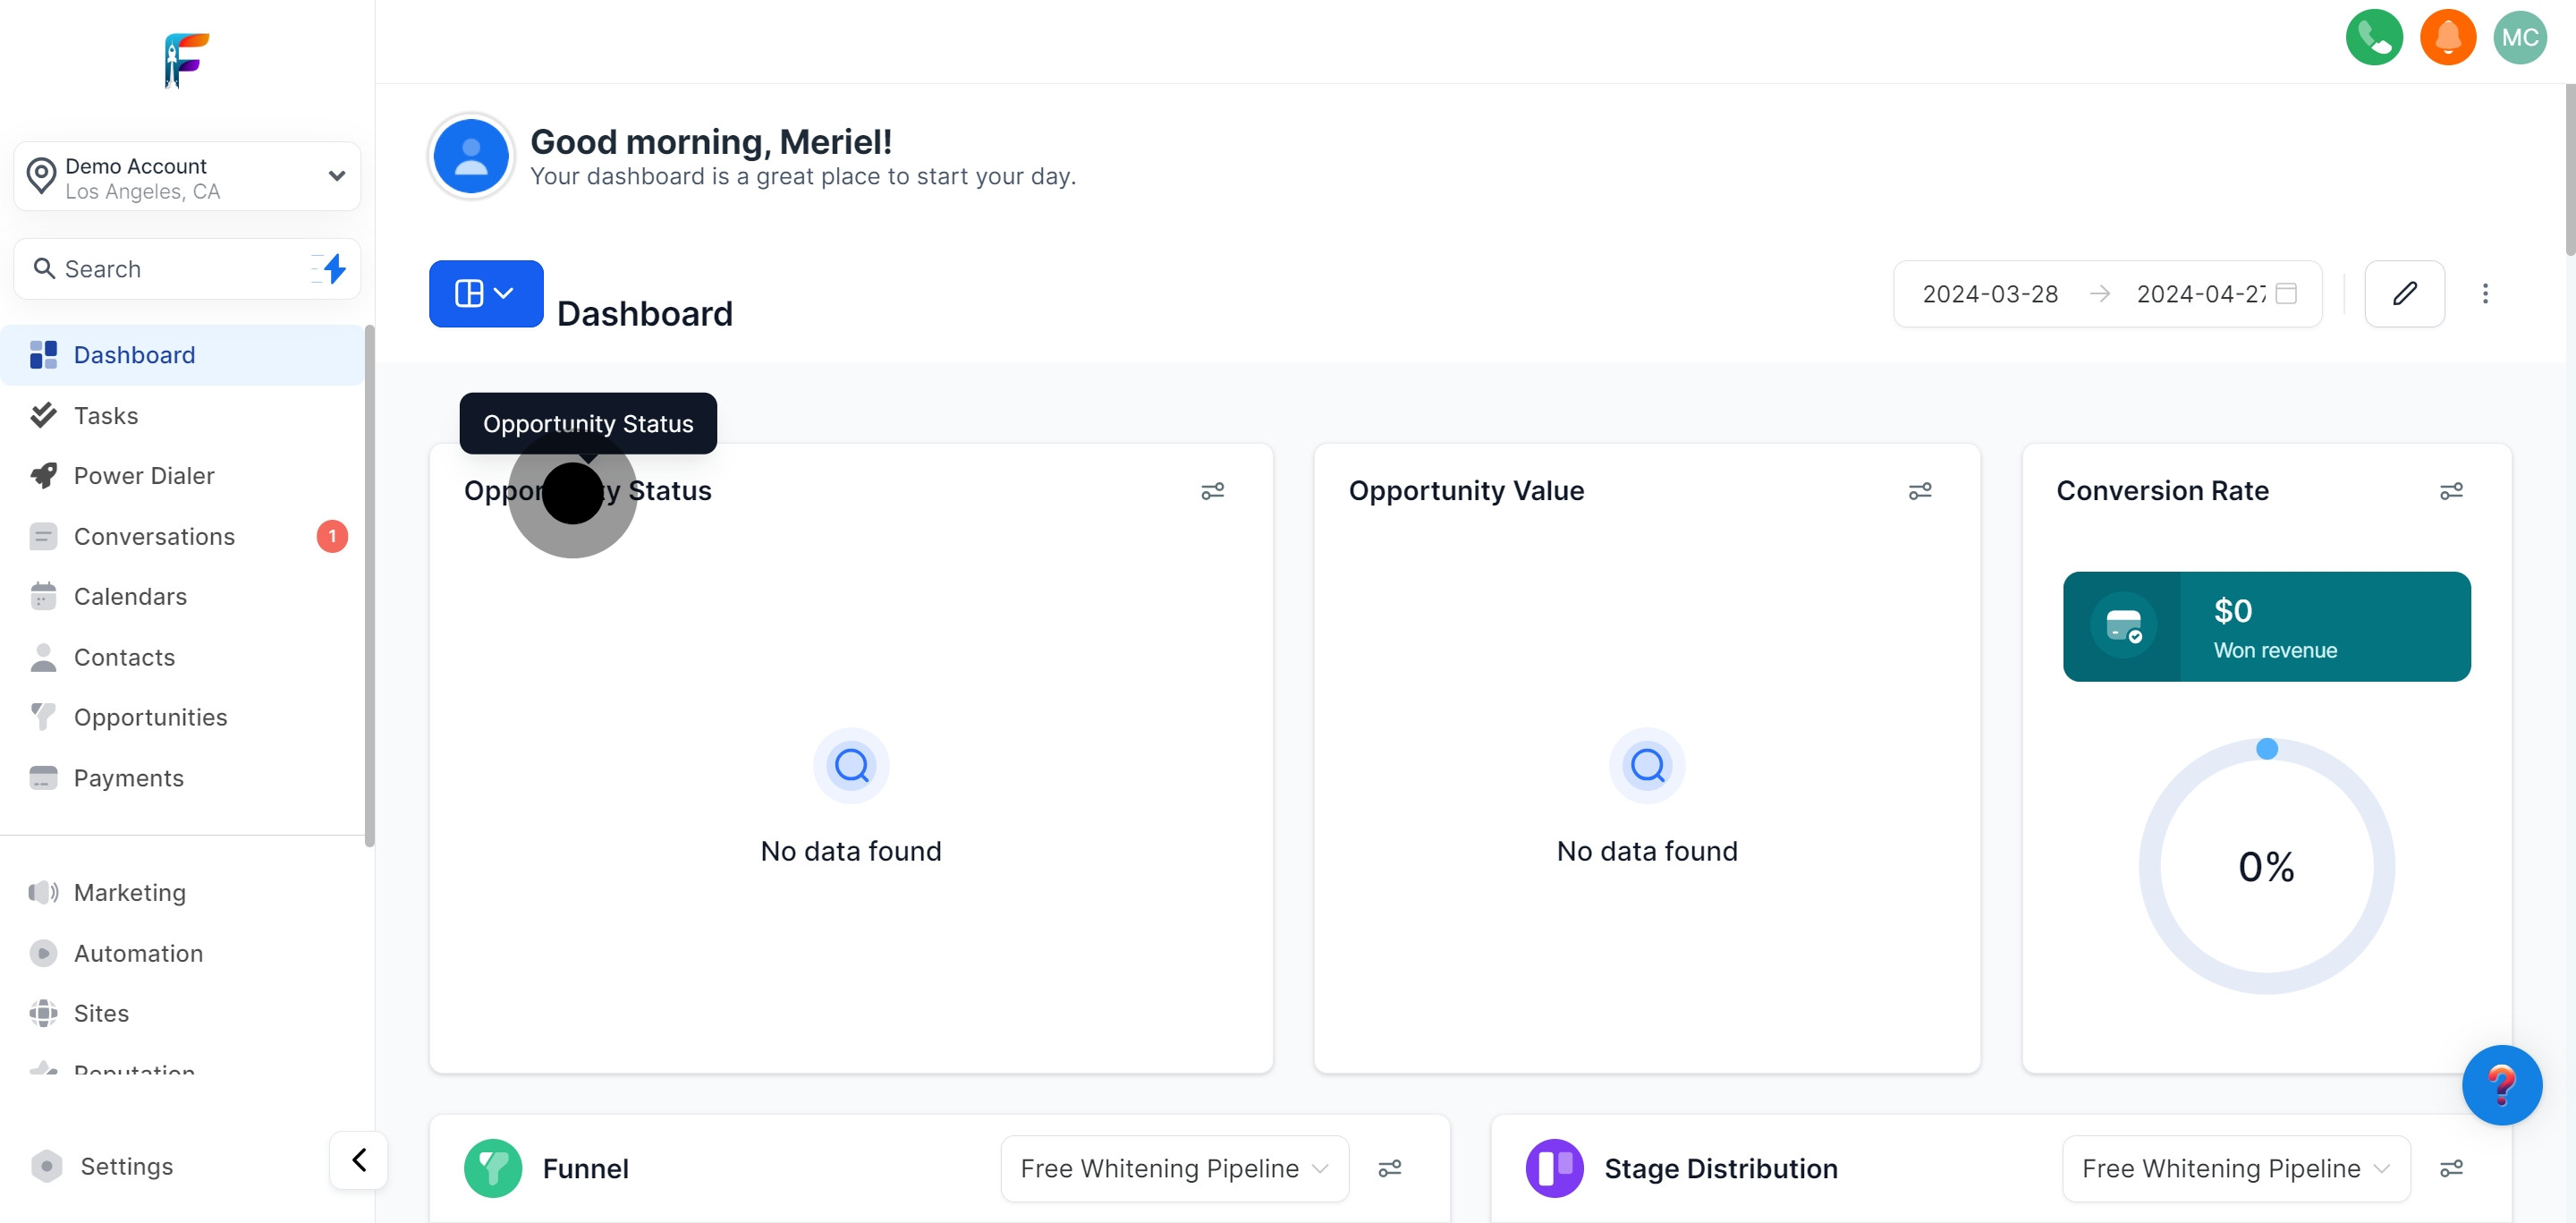
Understand how to monitor current opportunity statuses and track progression to optimize sales efforts.
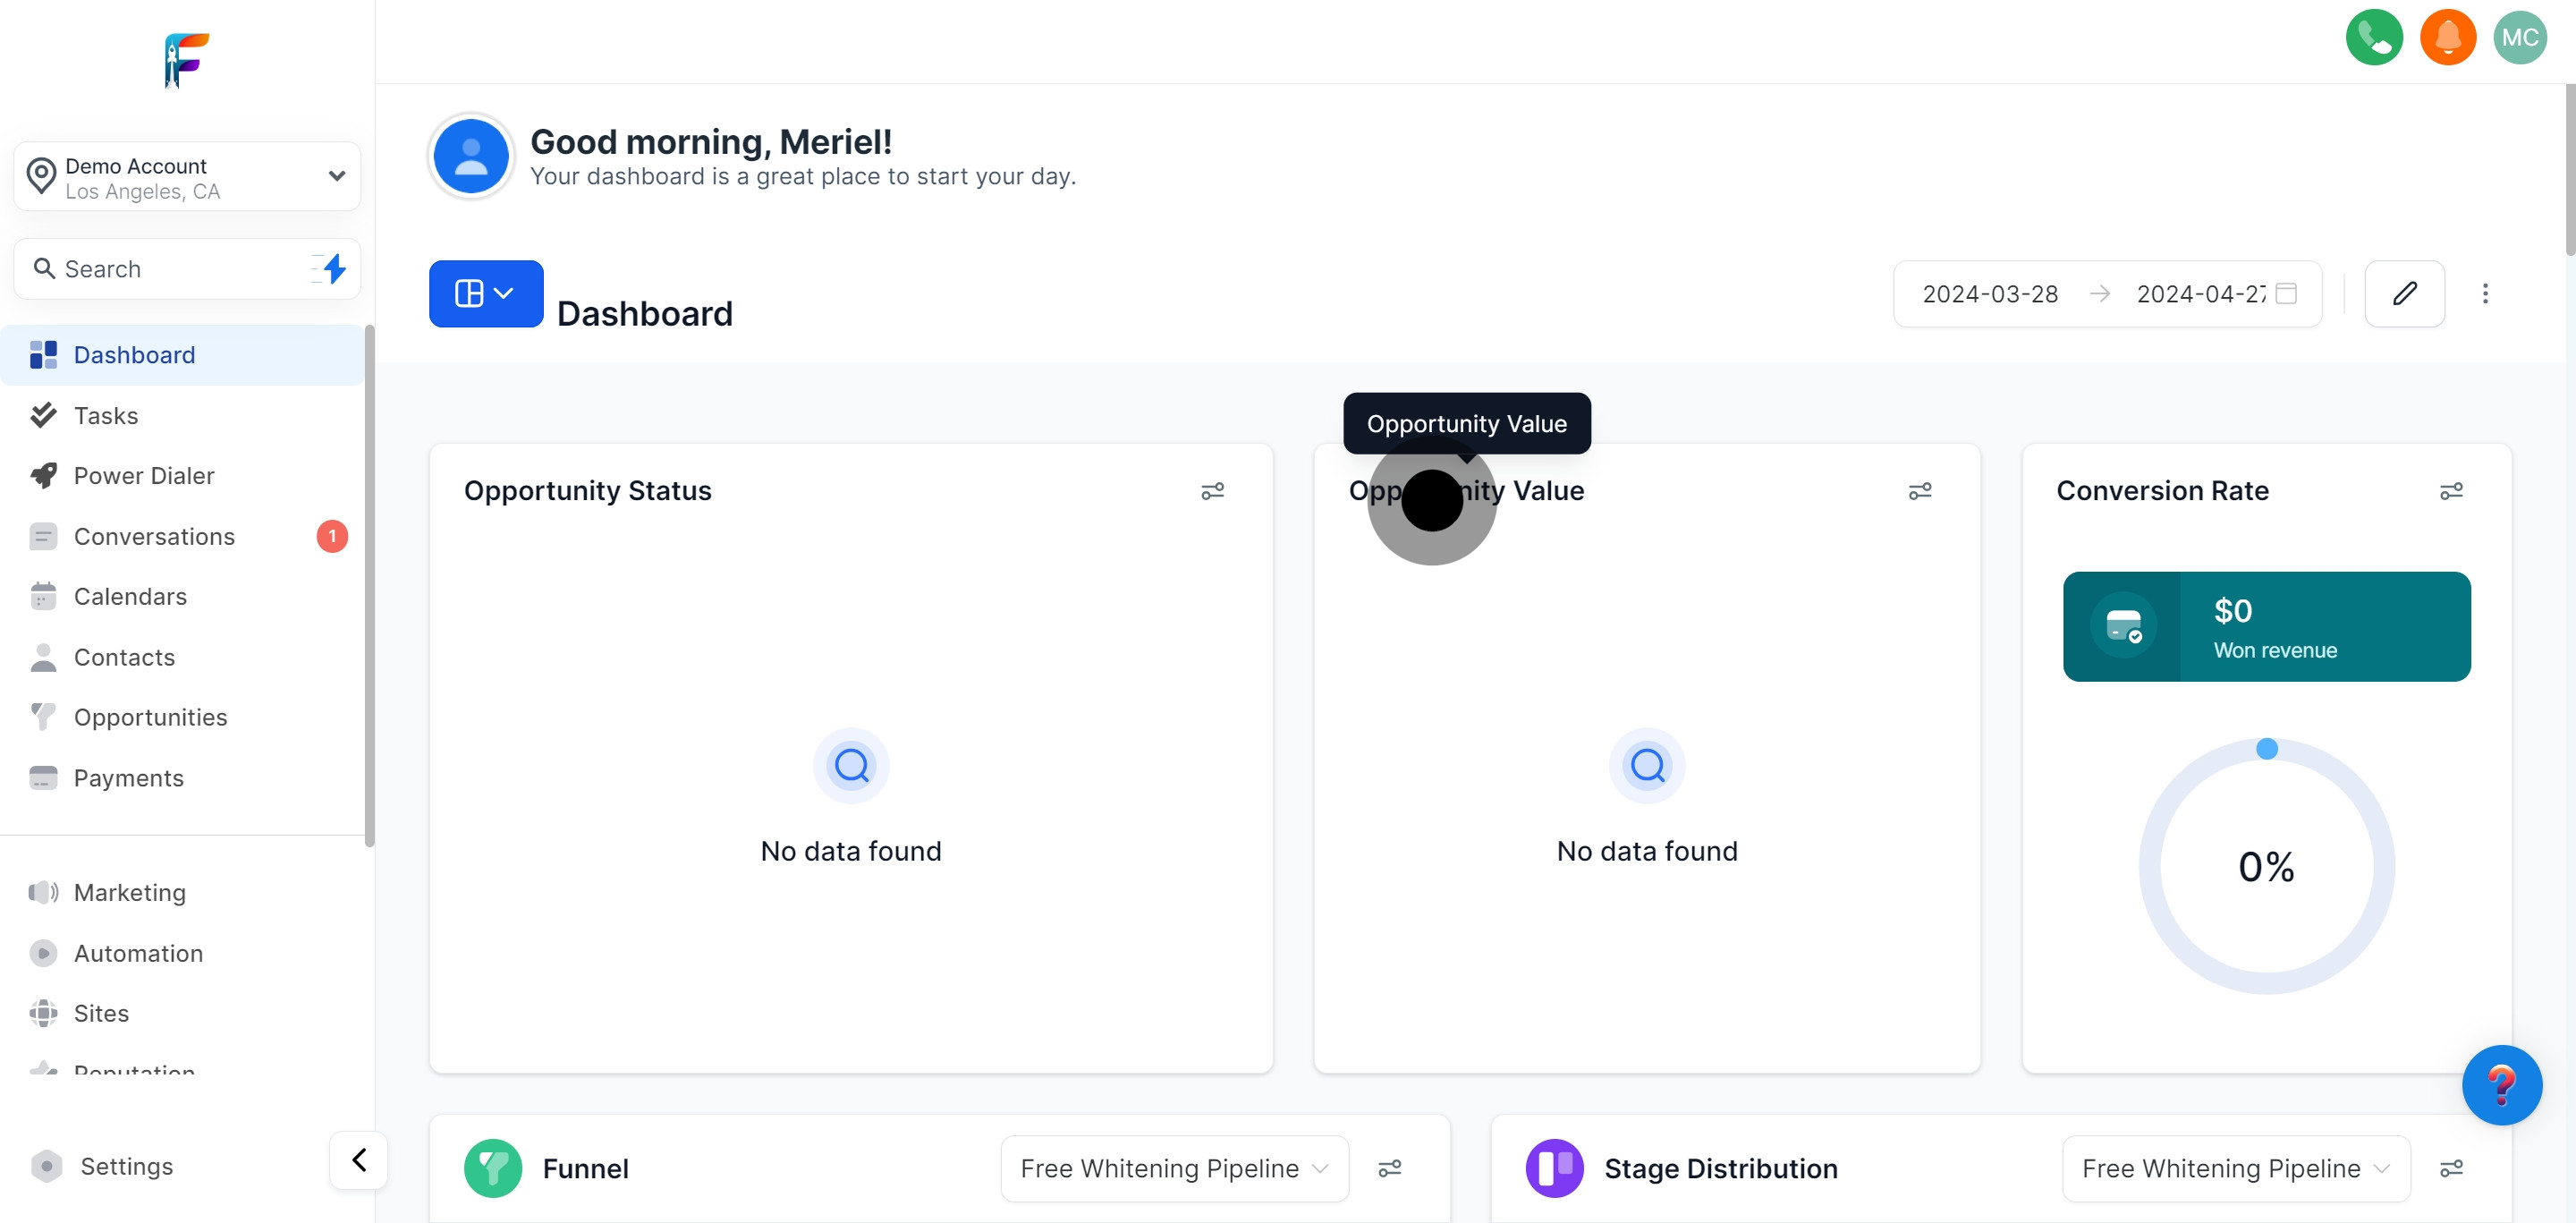
Analyze the monetary worth of all current business opportunities and projected revenue.
View your conversion statistics to assess the success of your marketing and sales strategies.
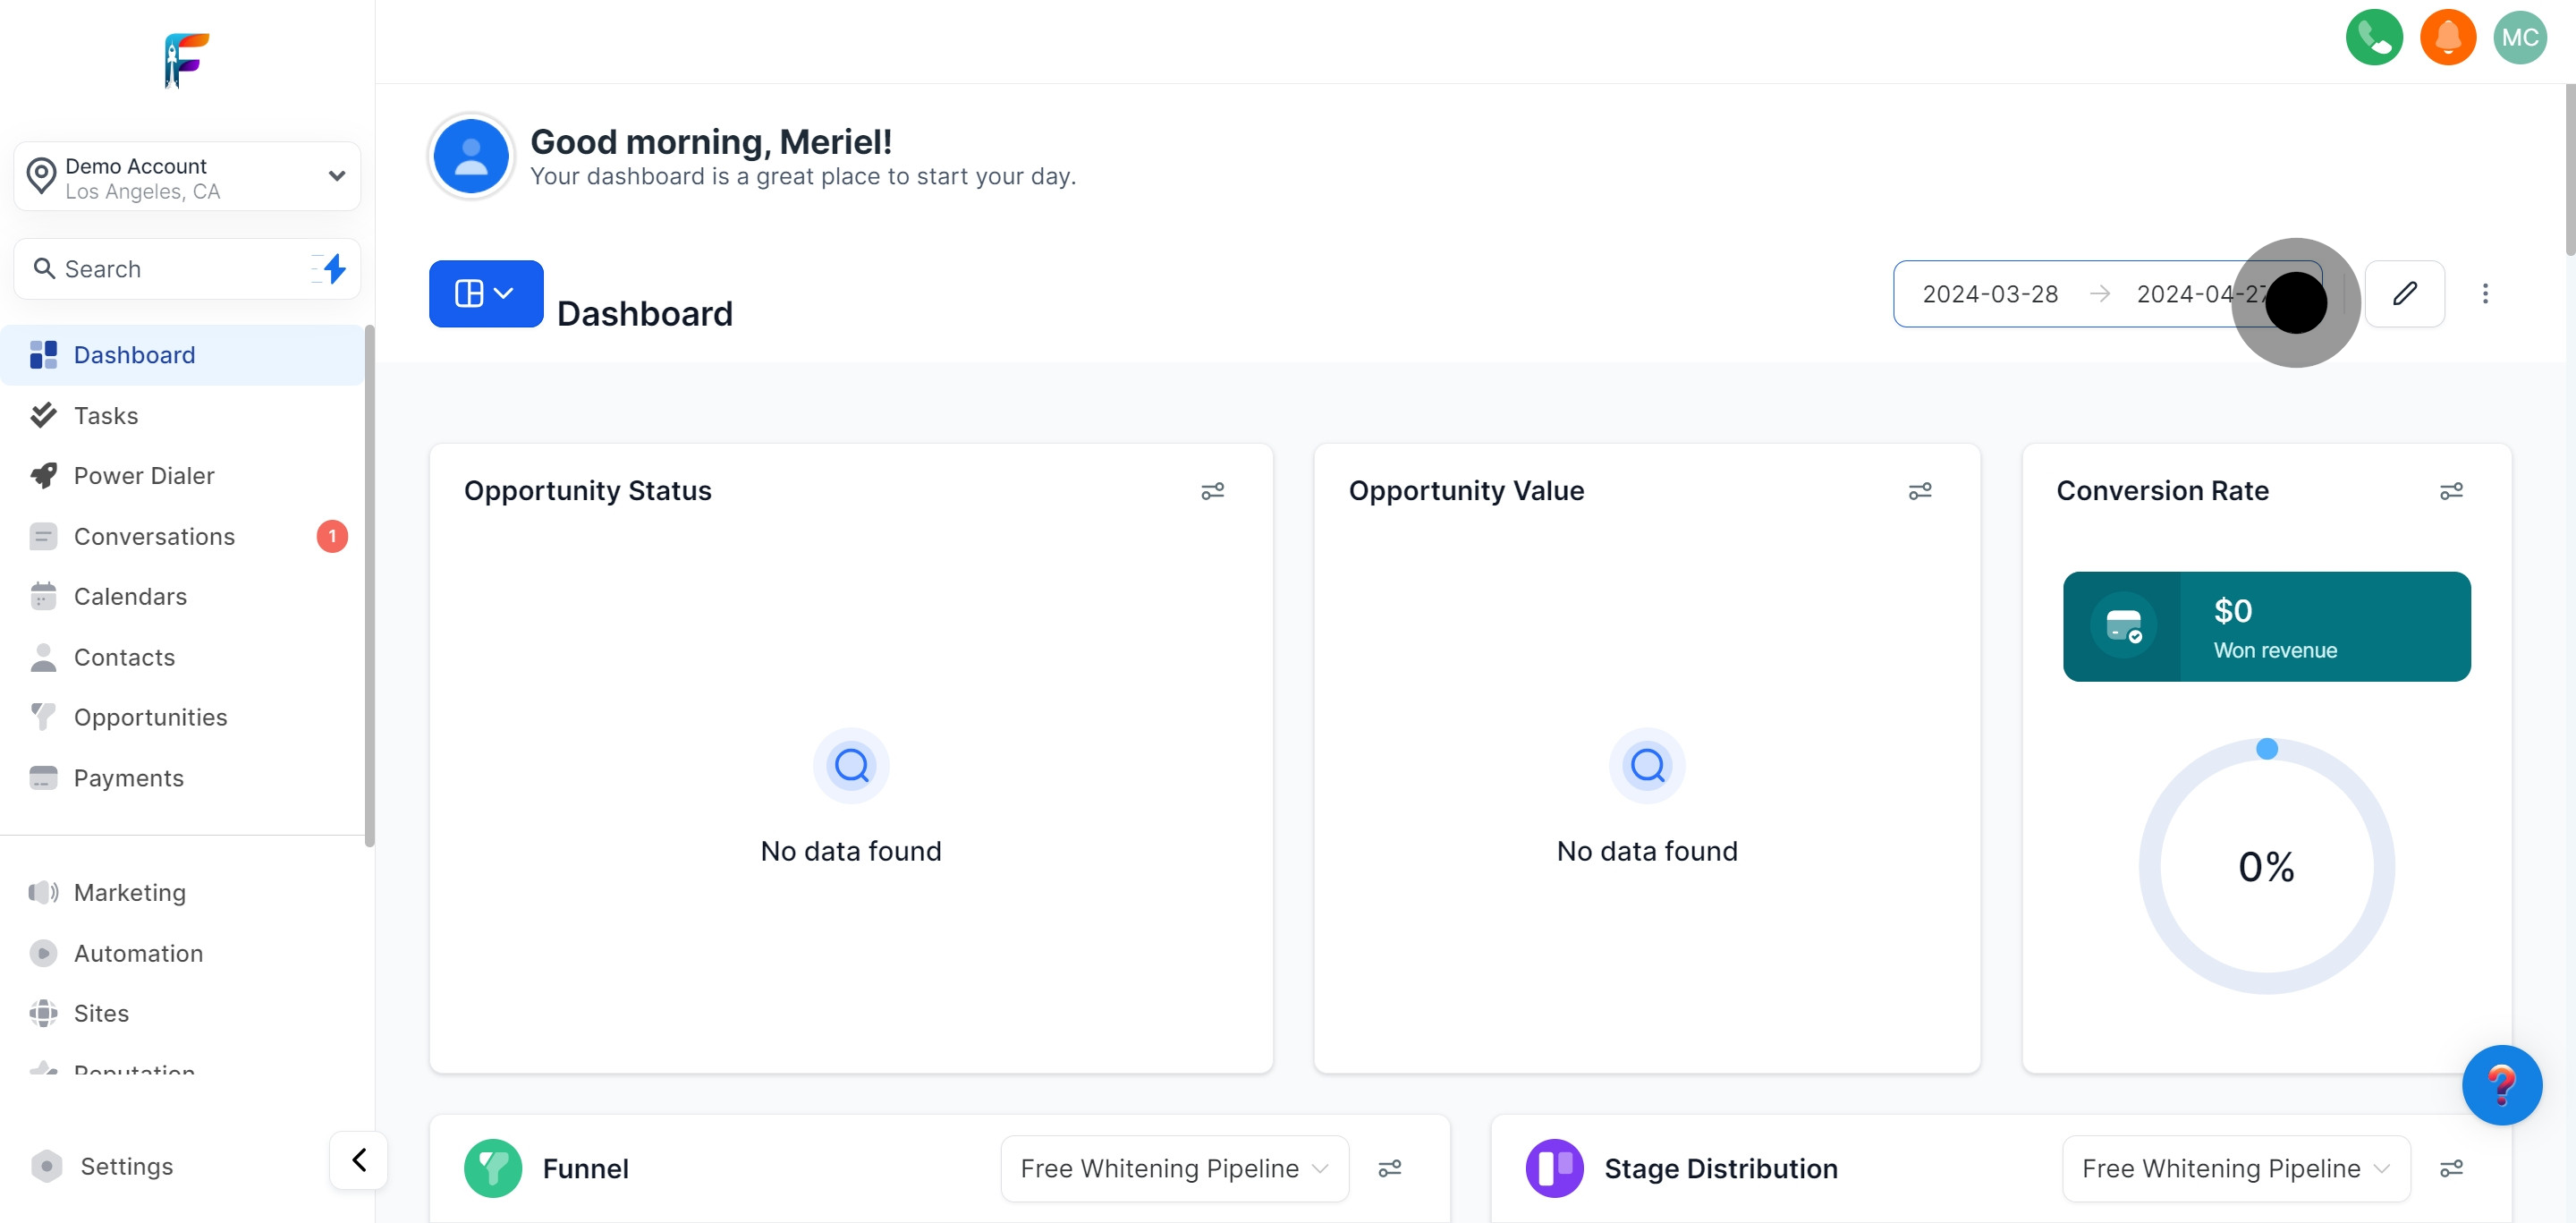
Use the calendar to select specific date ranges to display data relevant to those periods.
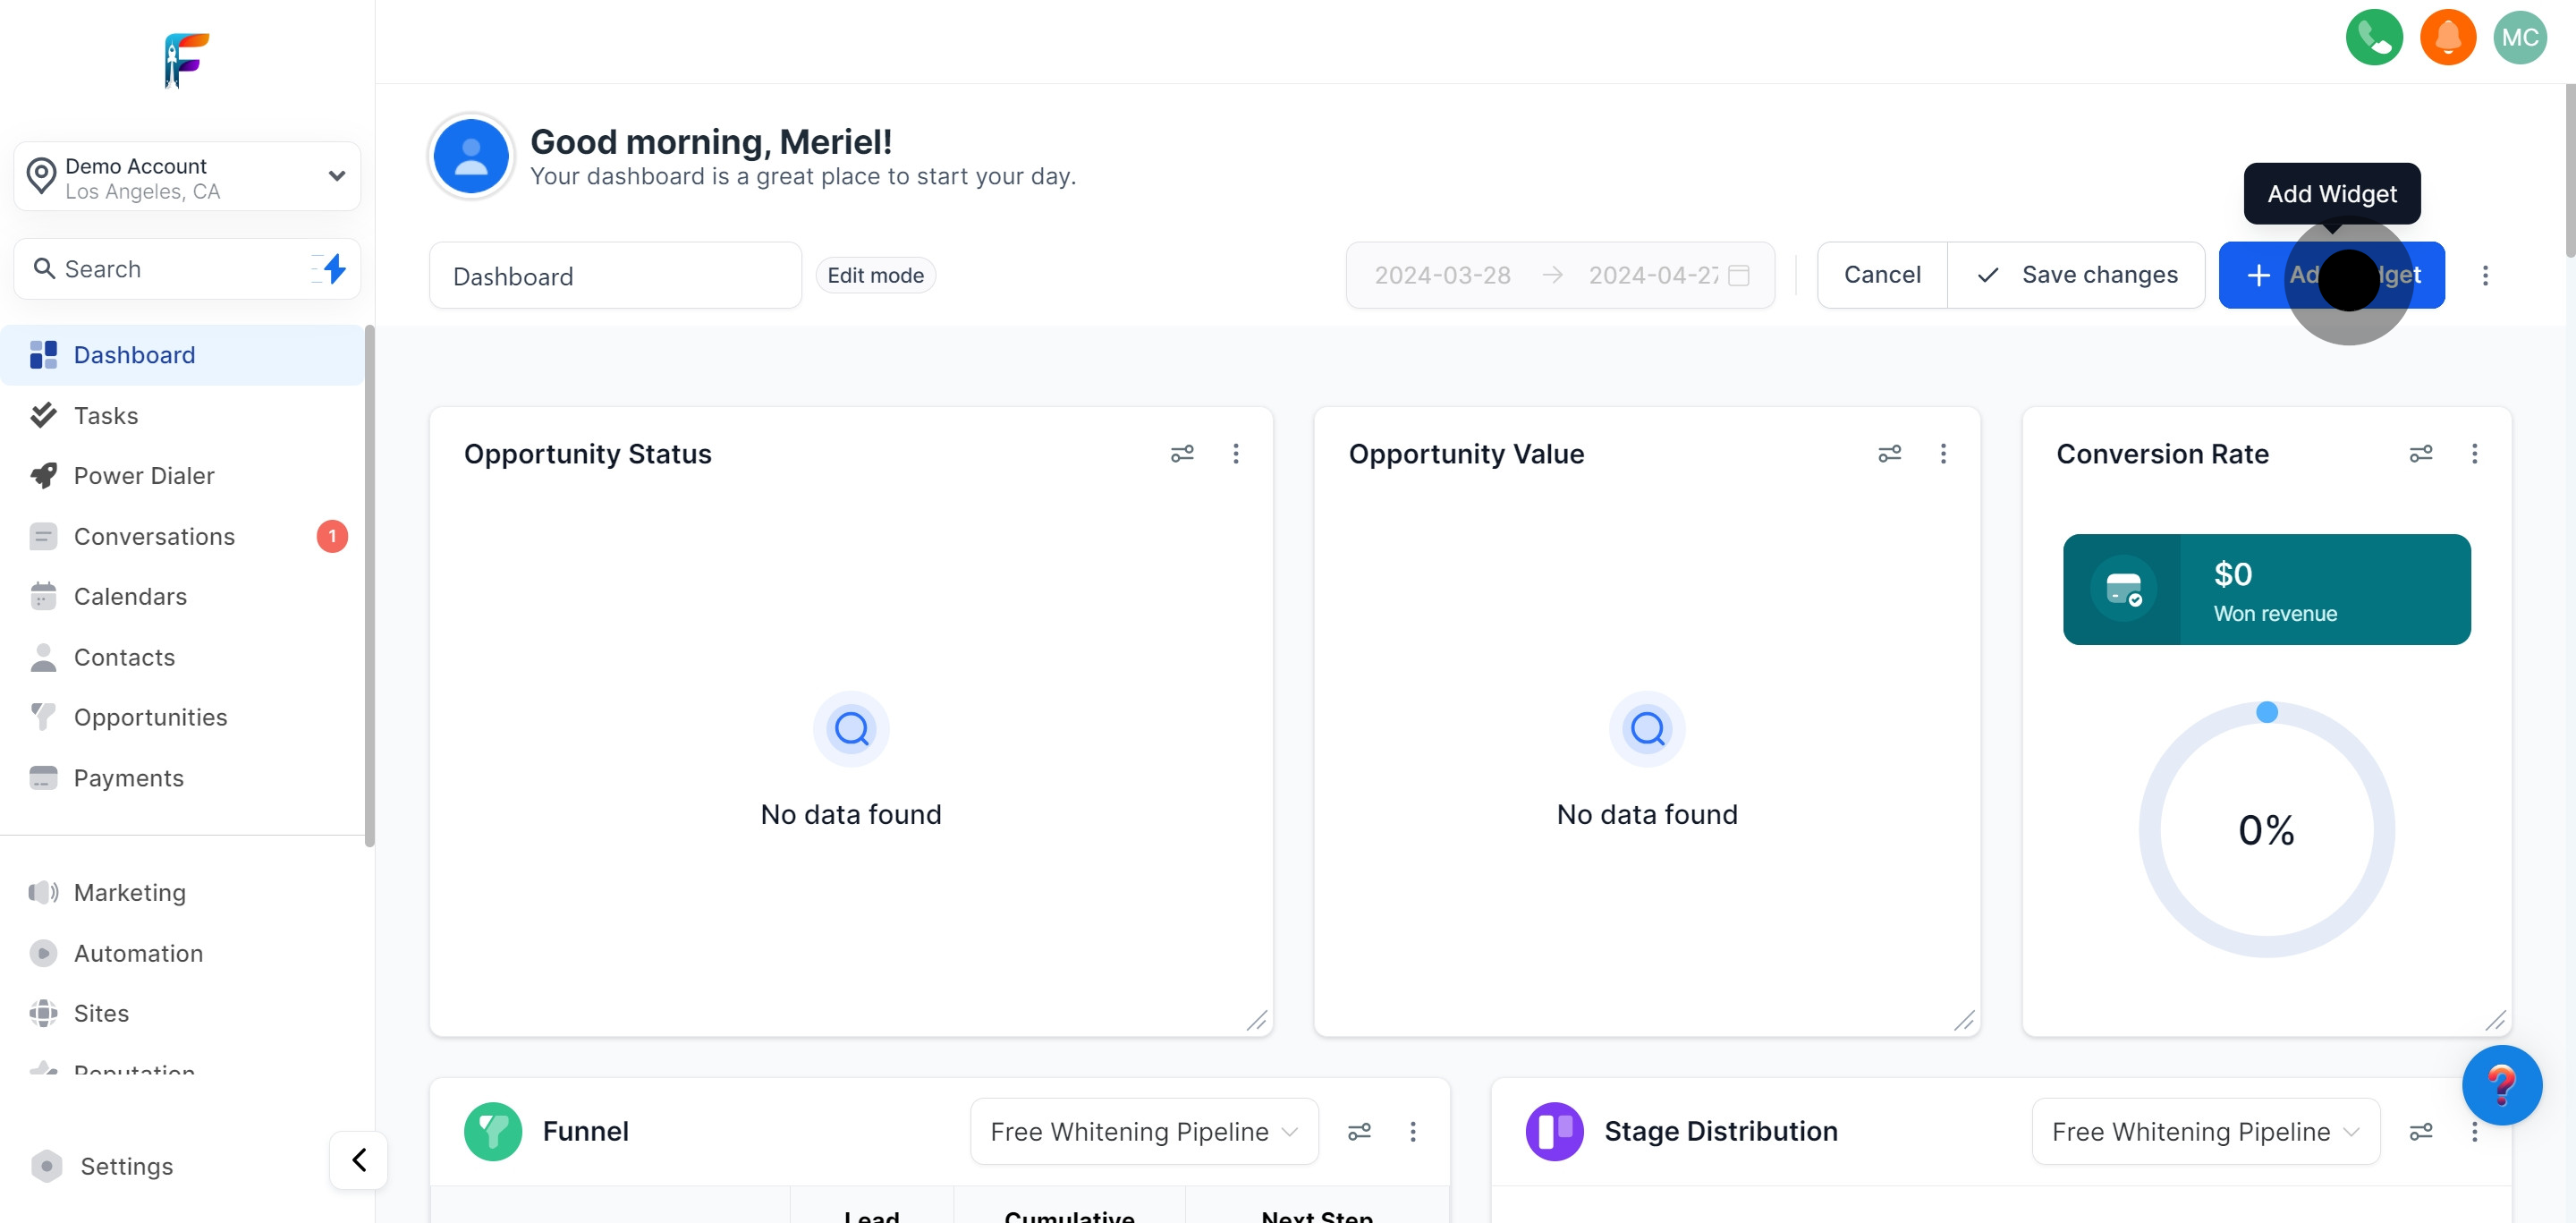
Learn how to customize your dashboard by adding extra widgets that cater to your specific business needs.
Access and manage your customer and client contact information efficiently.
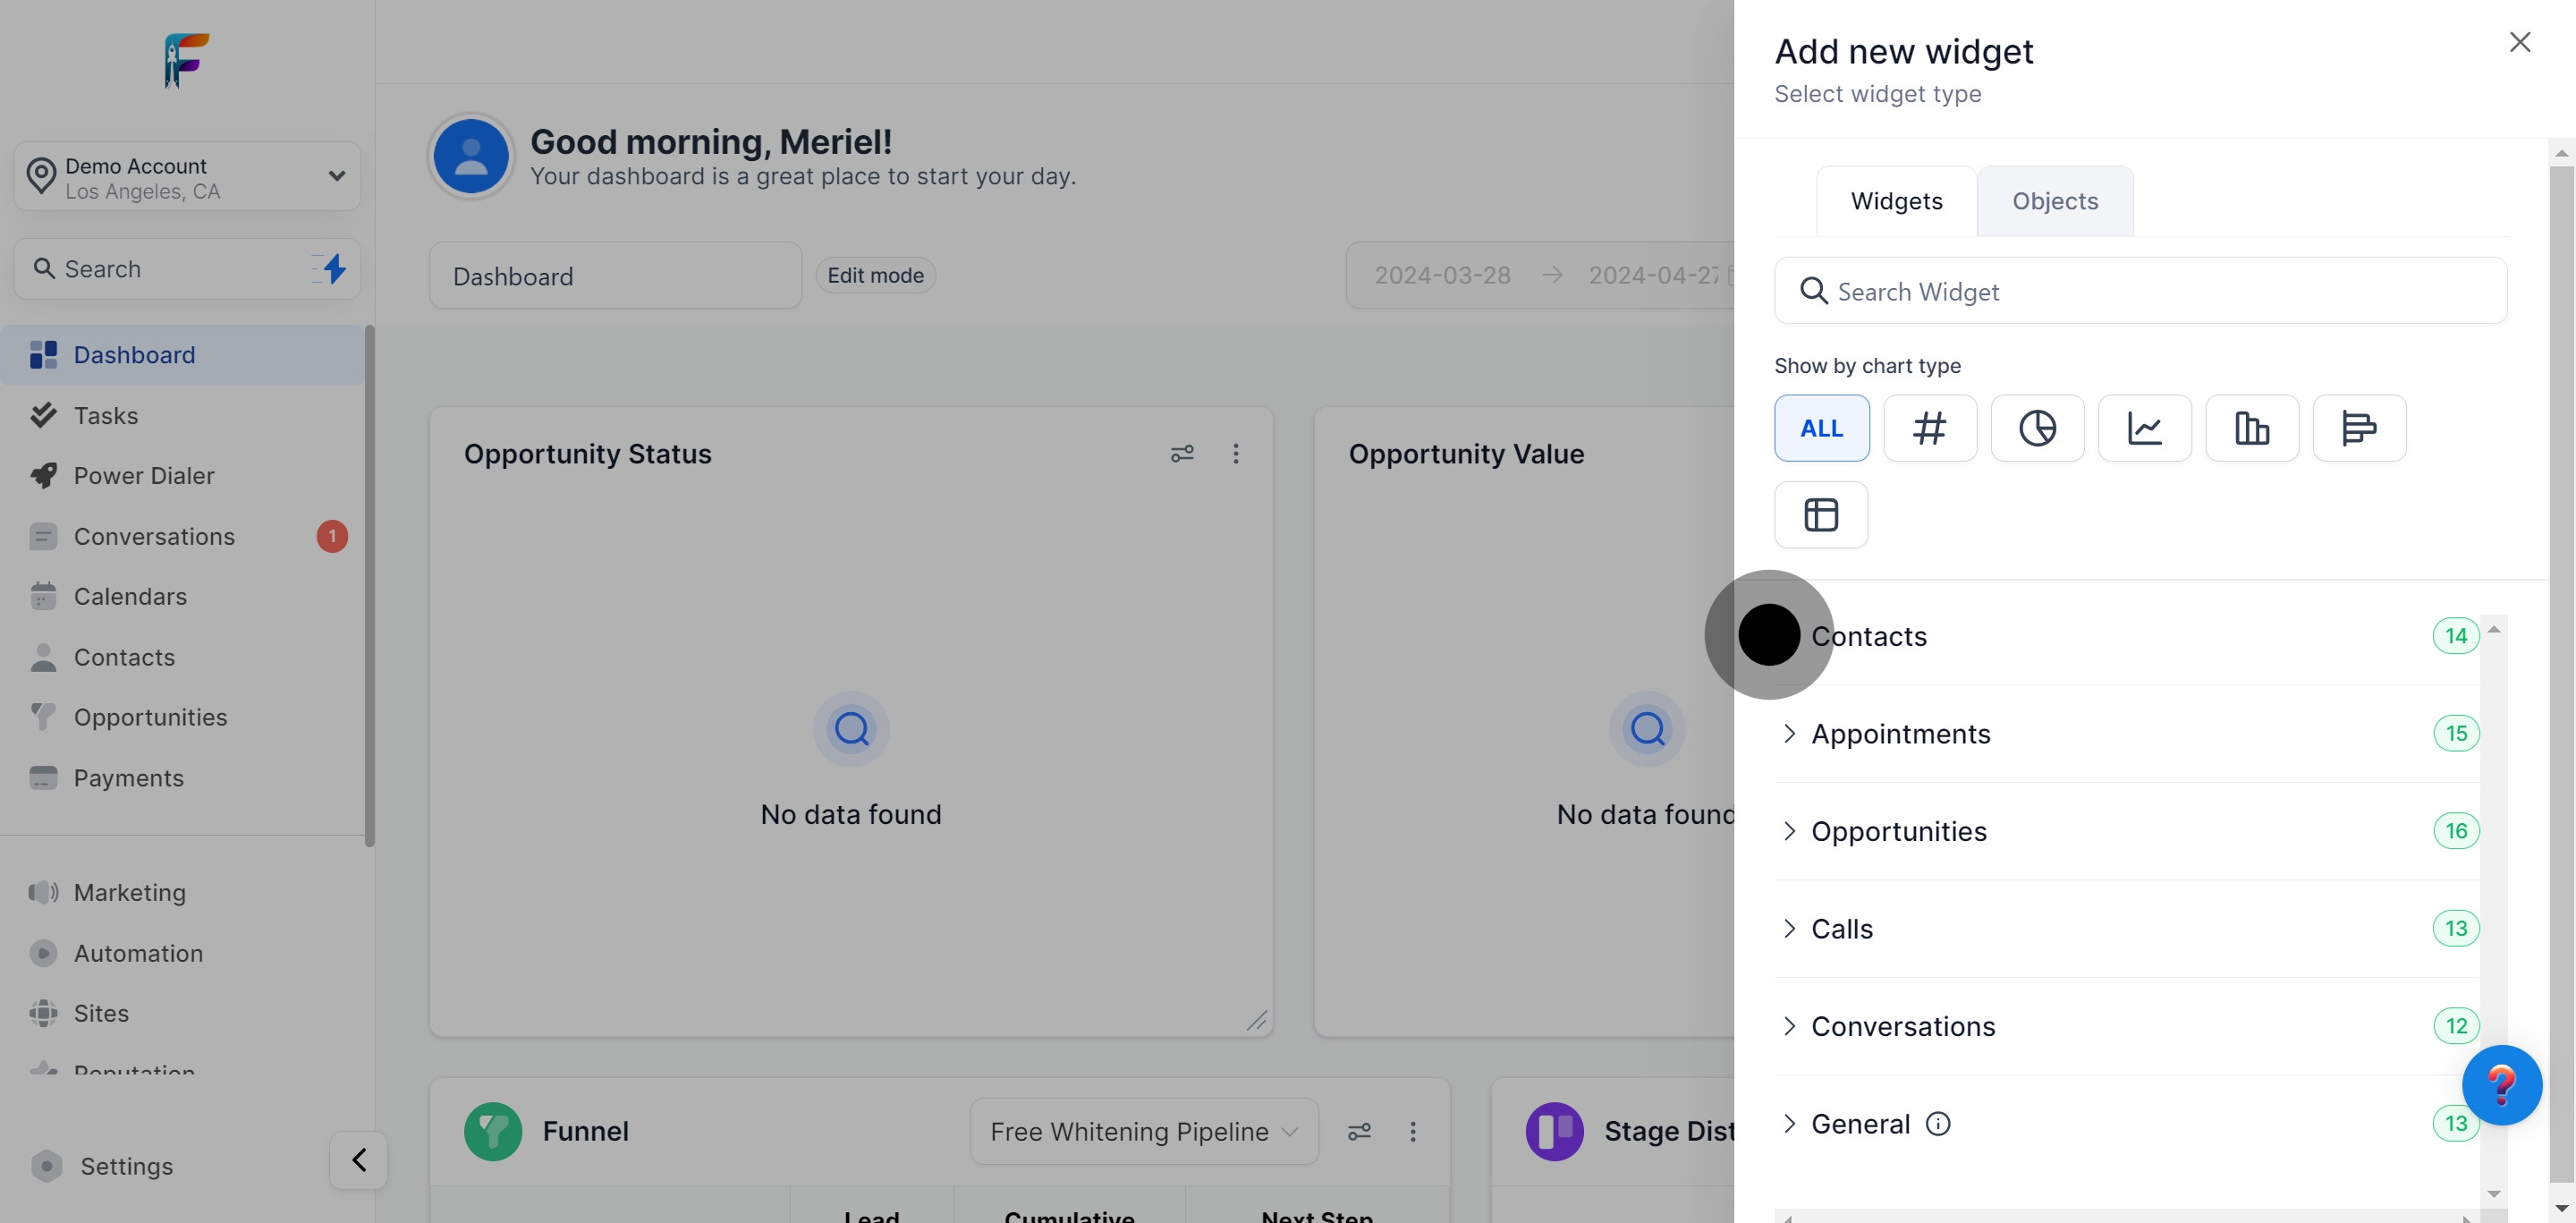
Keep track of your scheduled meetings and appointments with ease.
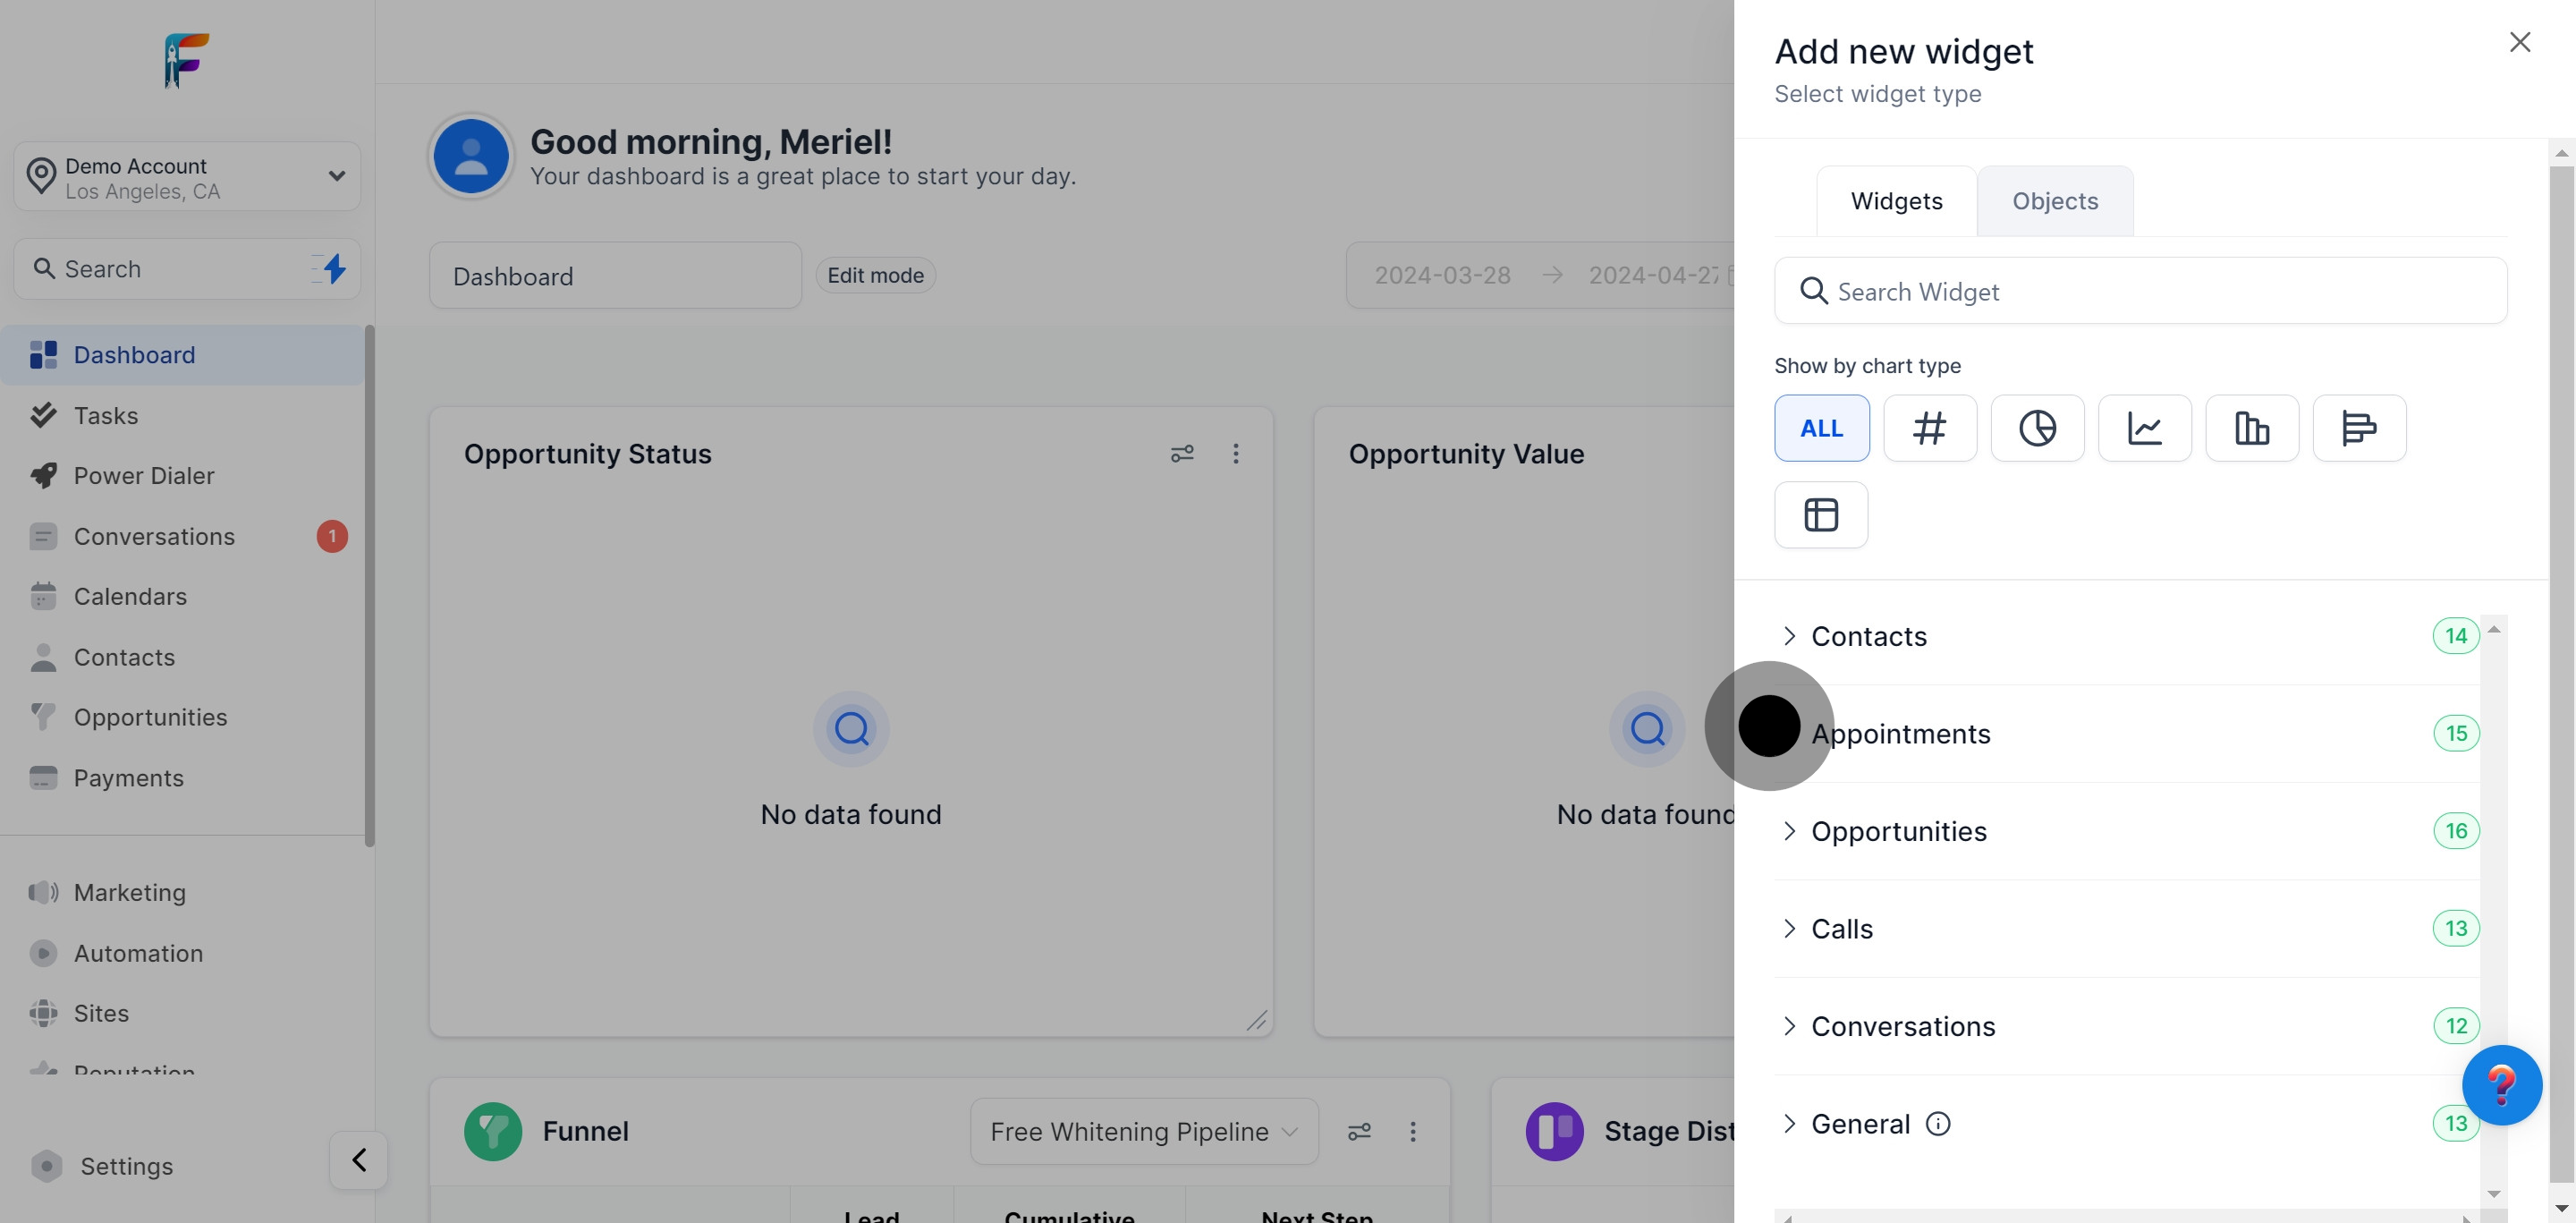
Get an overview of ongoing sales opportunities and potential deals.
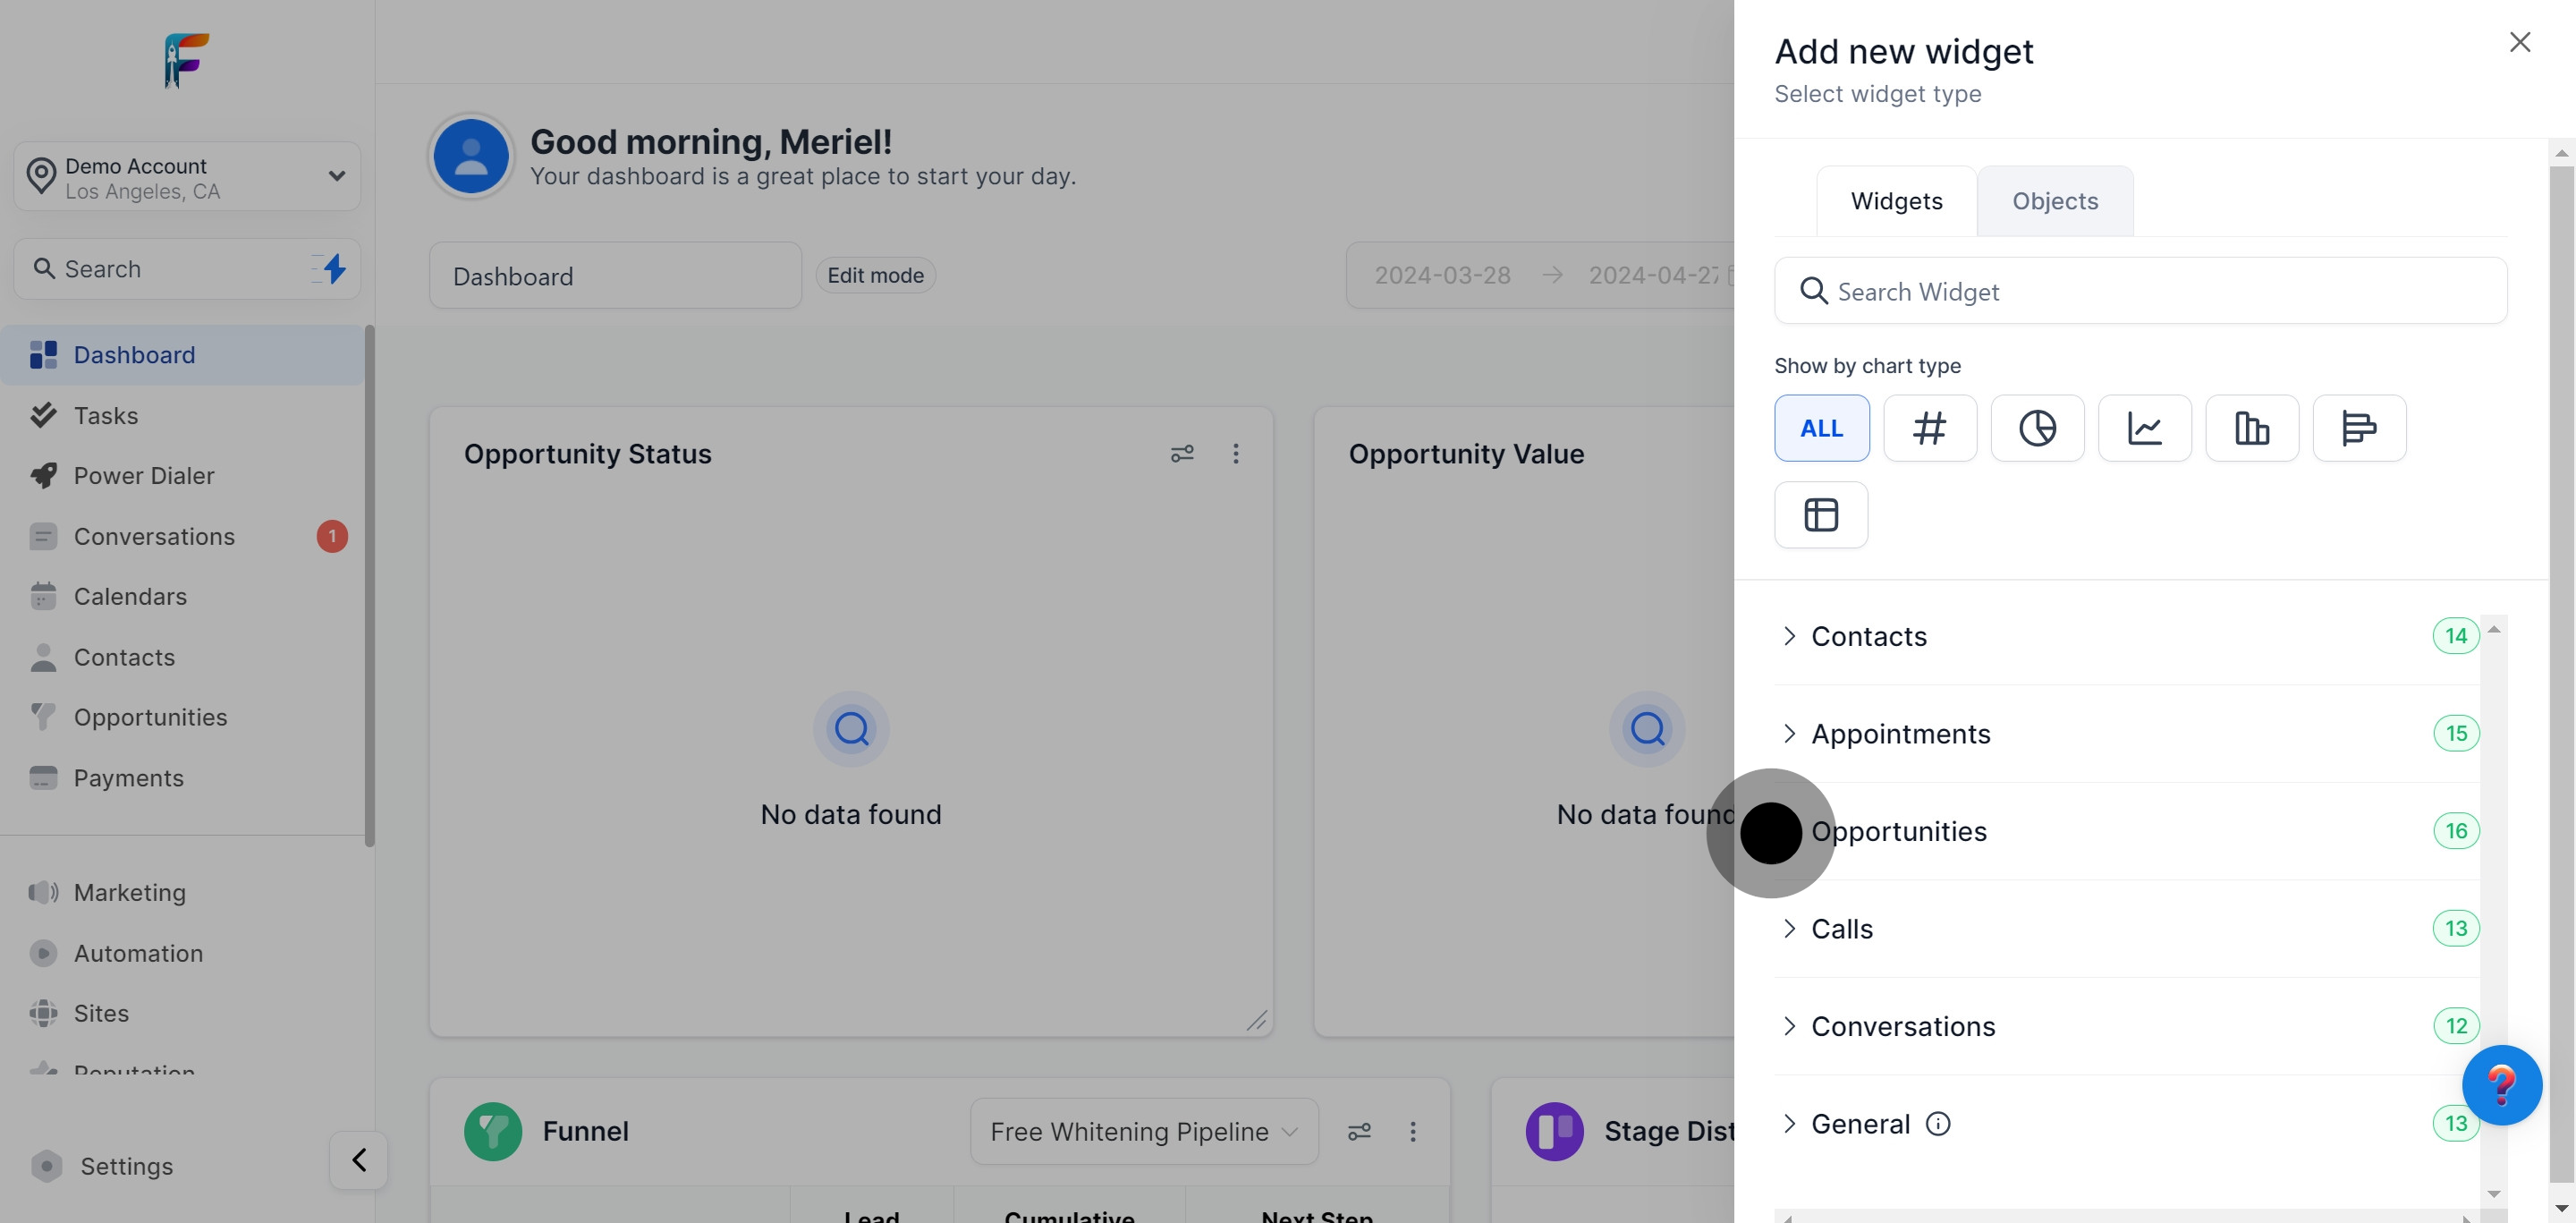
Evaluate your call activities to improve communication strategies with clients.
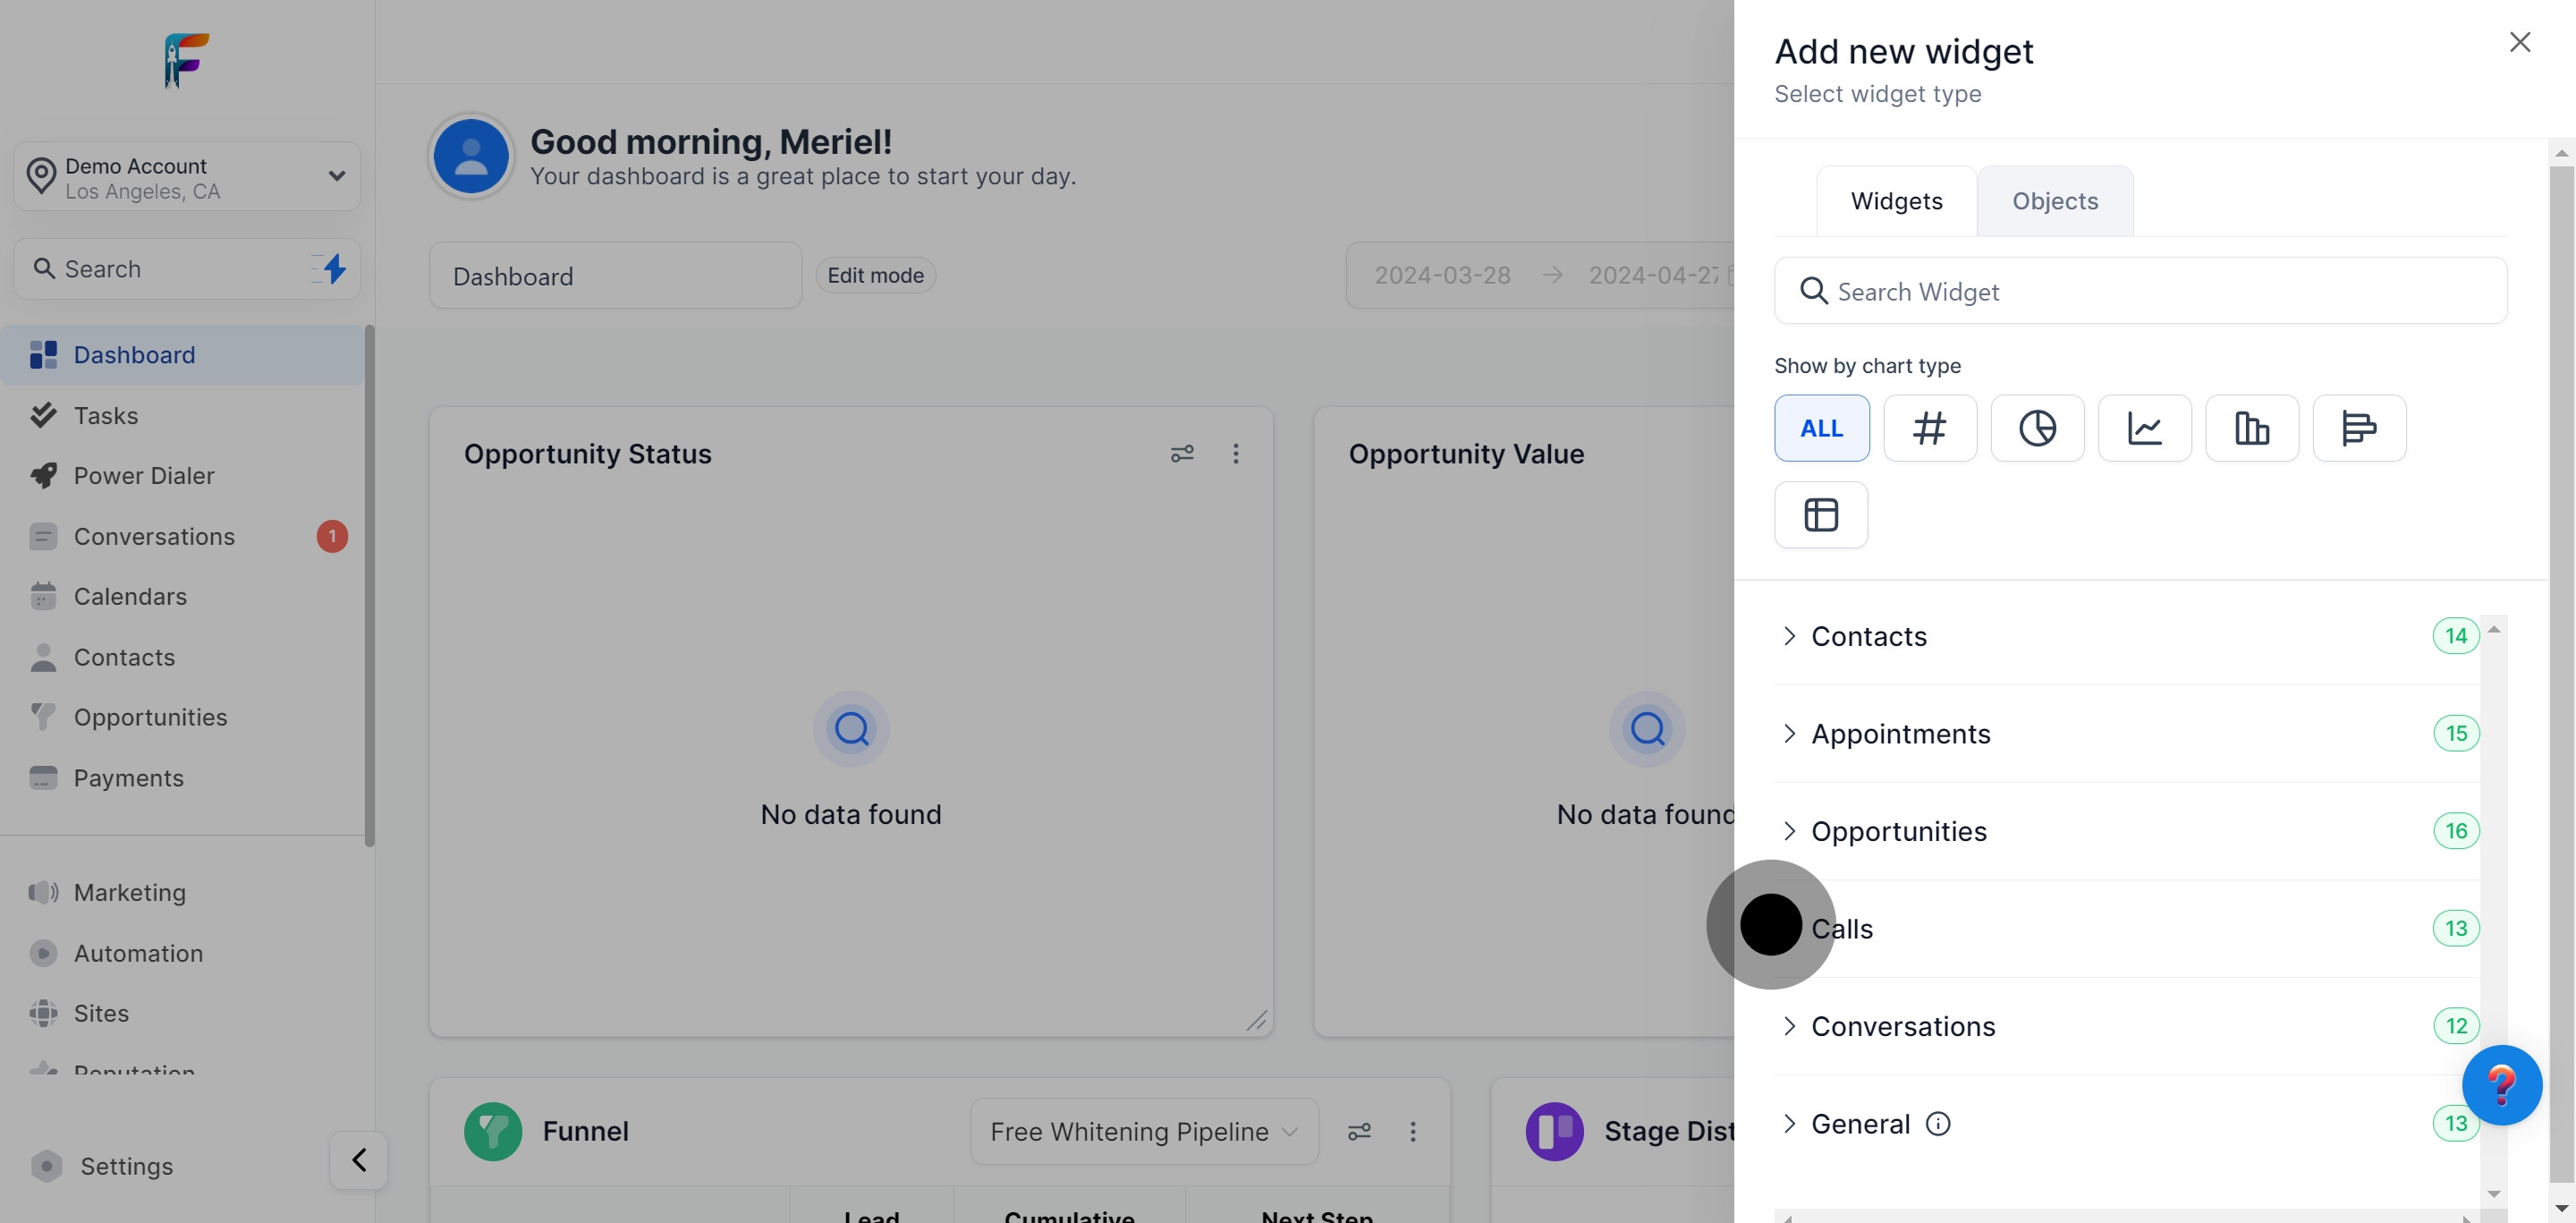
Monitor and analyze your team's communication with prospects and customers.
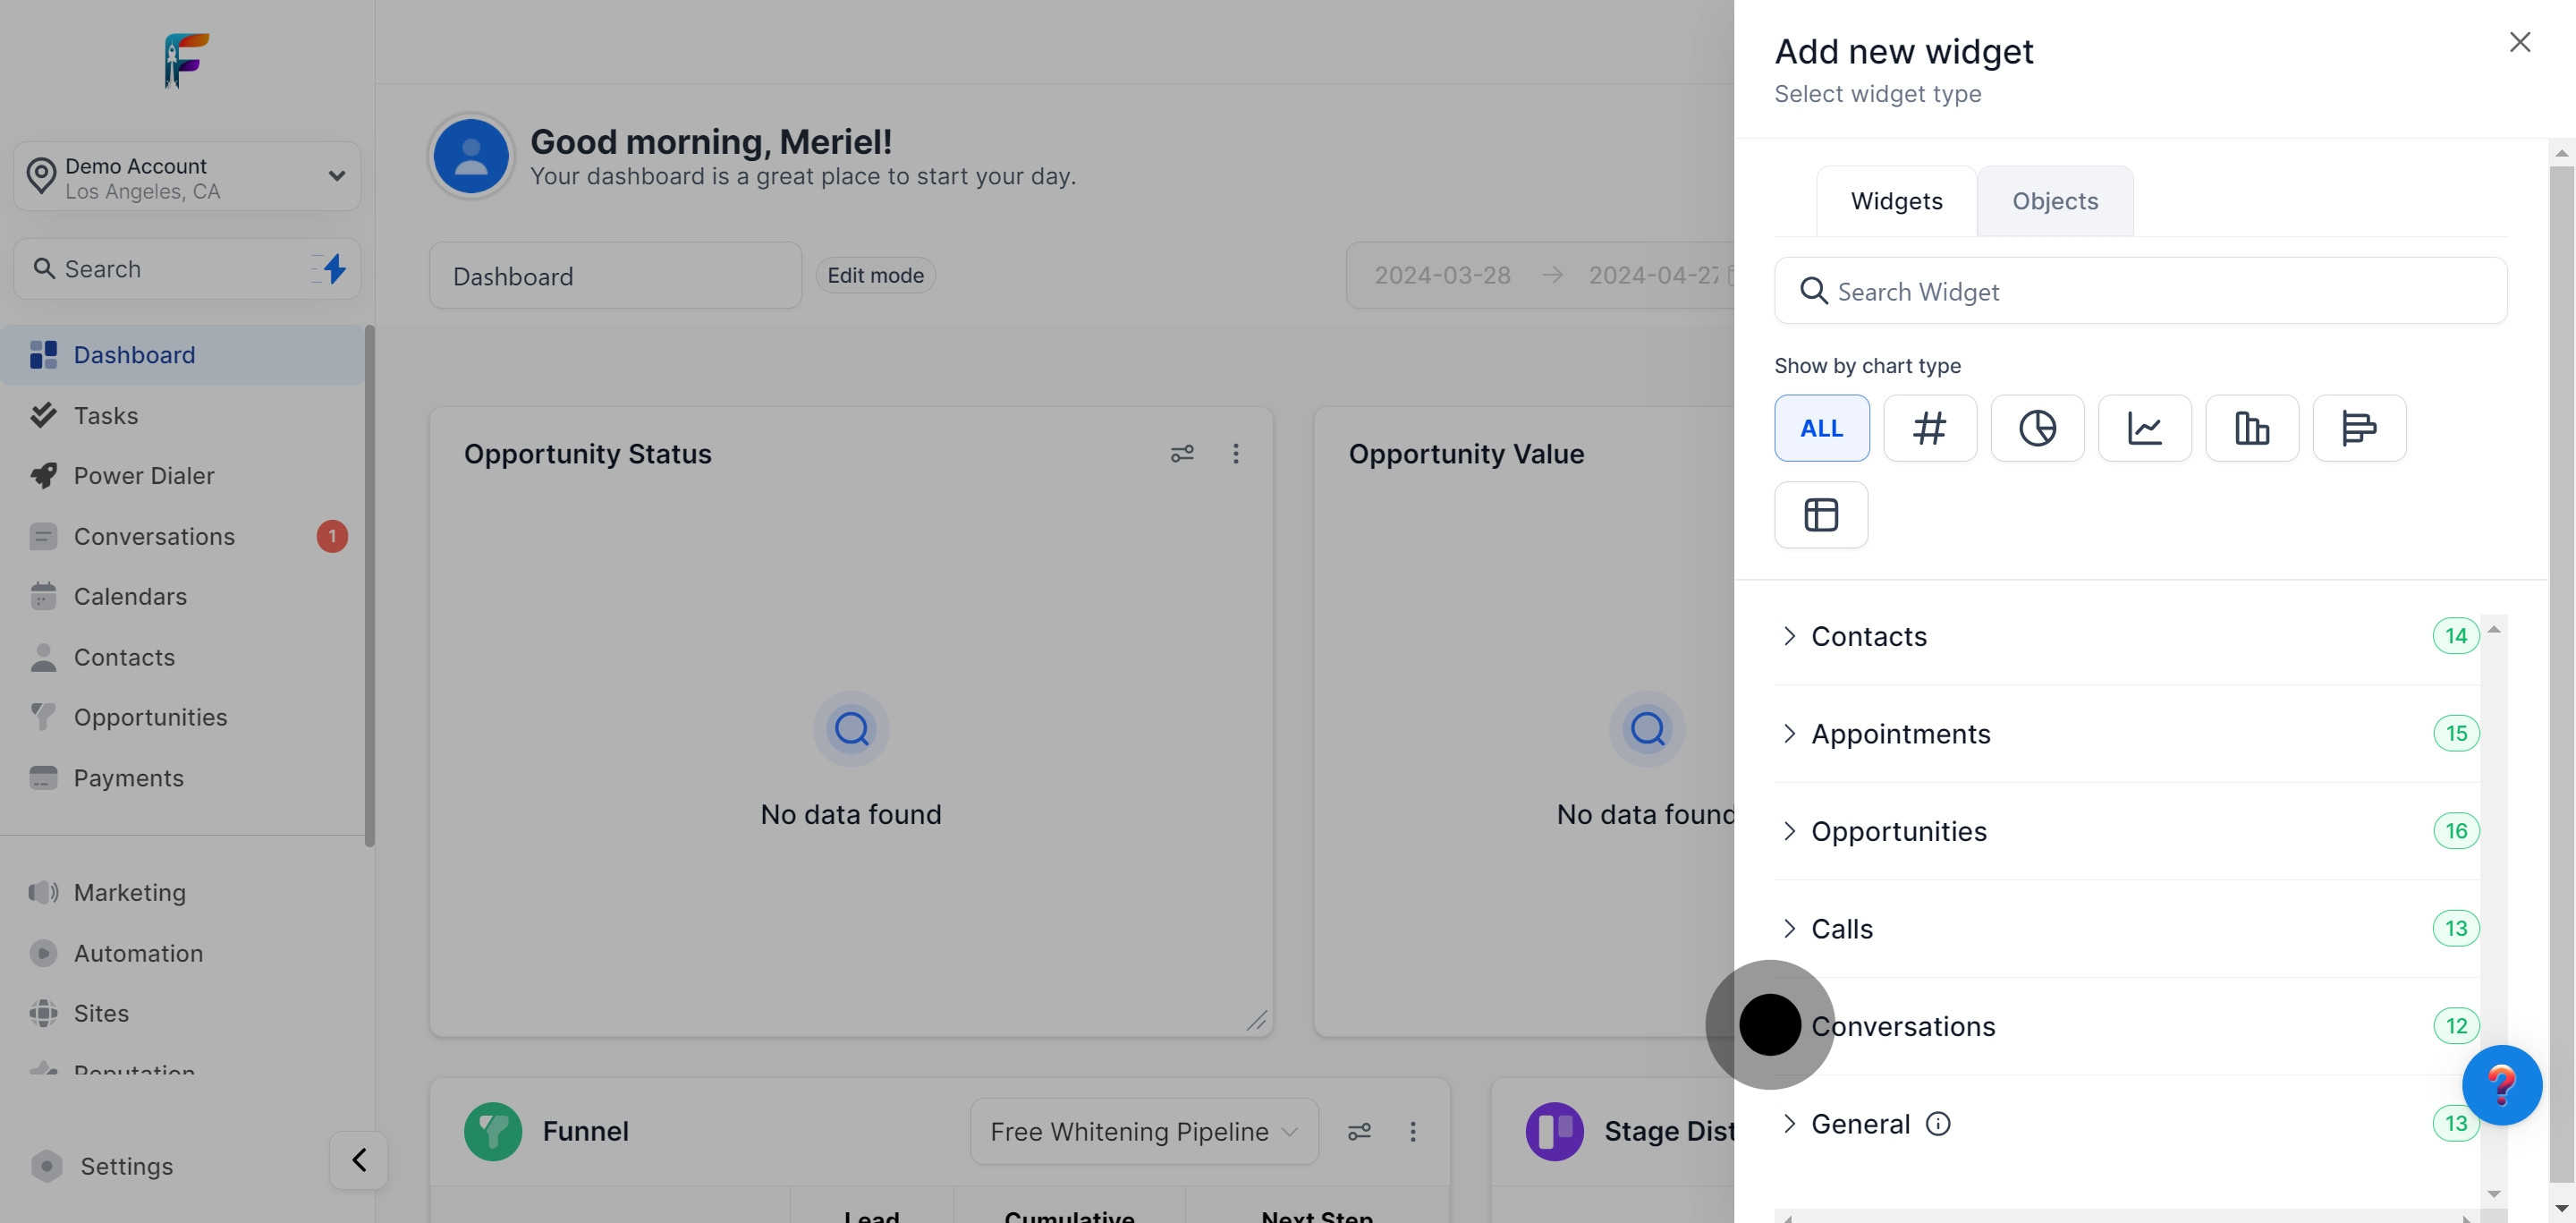
Gain a general overview of varied aspects of your CRM data.

Ensure all modifications to your dashboard are saved and implemented.
Visualize and analyze the sales funnel to understand the customer journey better.
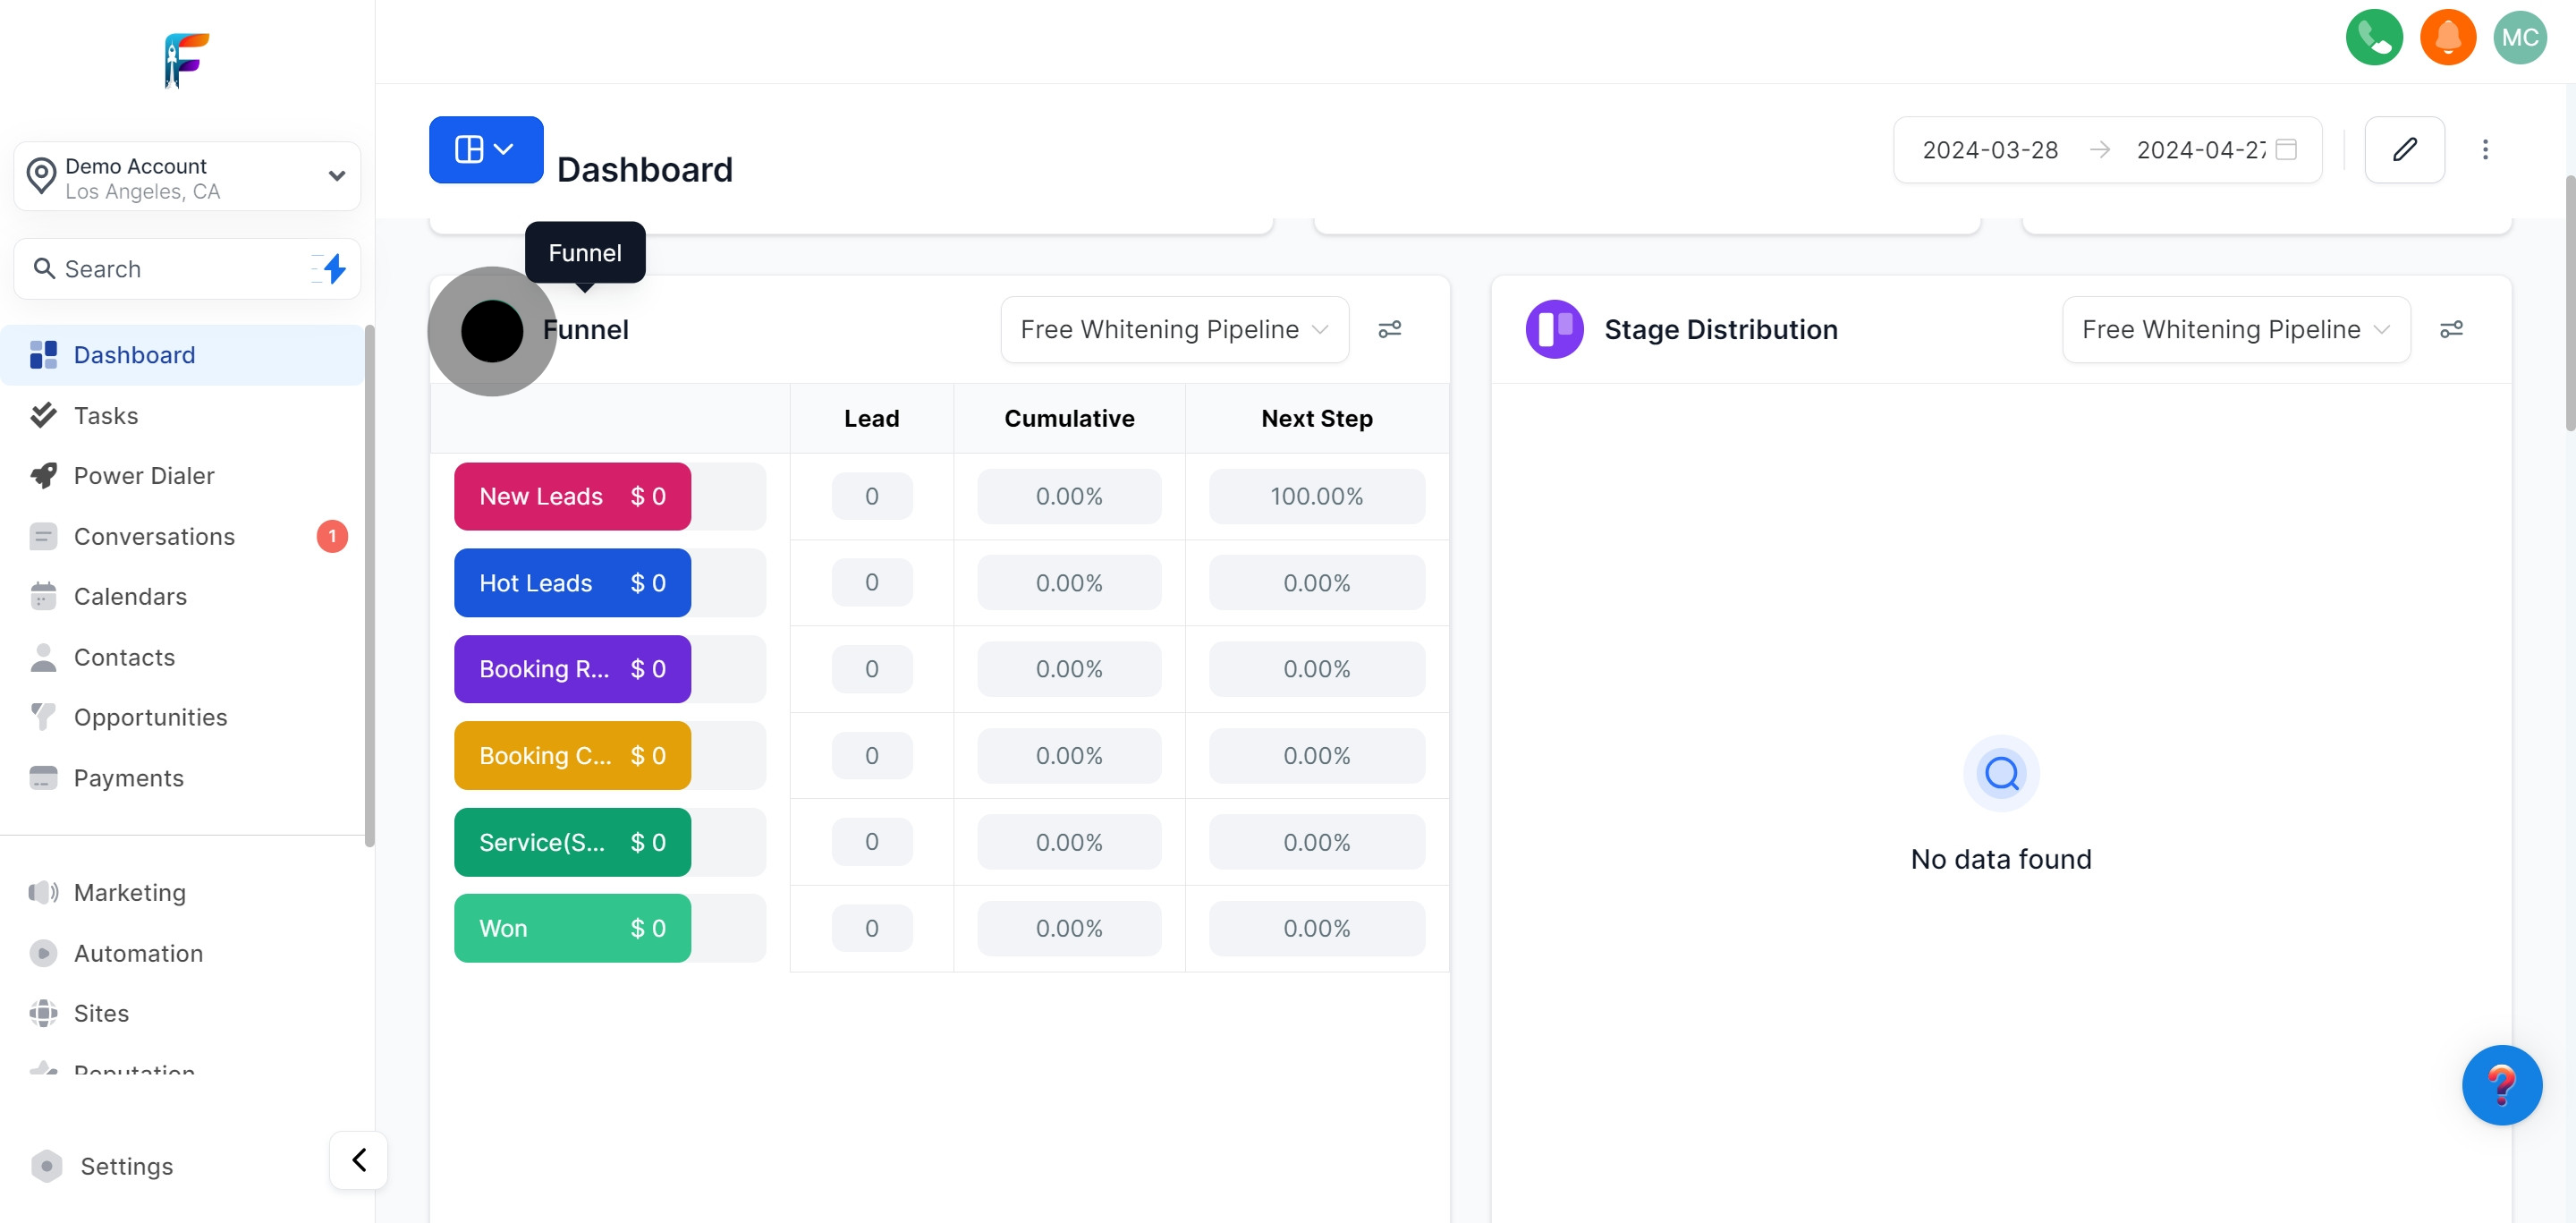
Analyze how opportunities are distributed across different stages of the sales process.
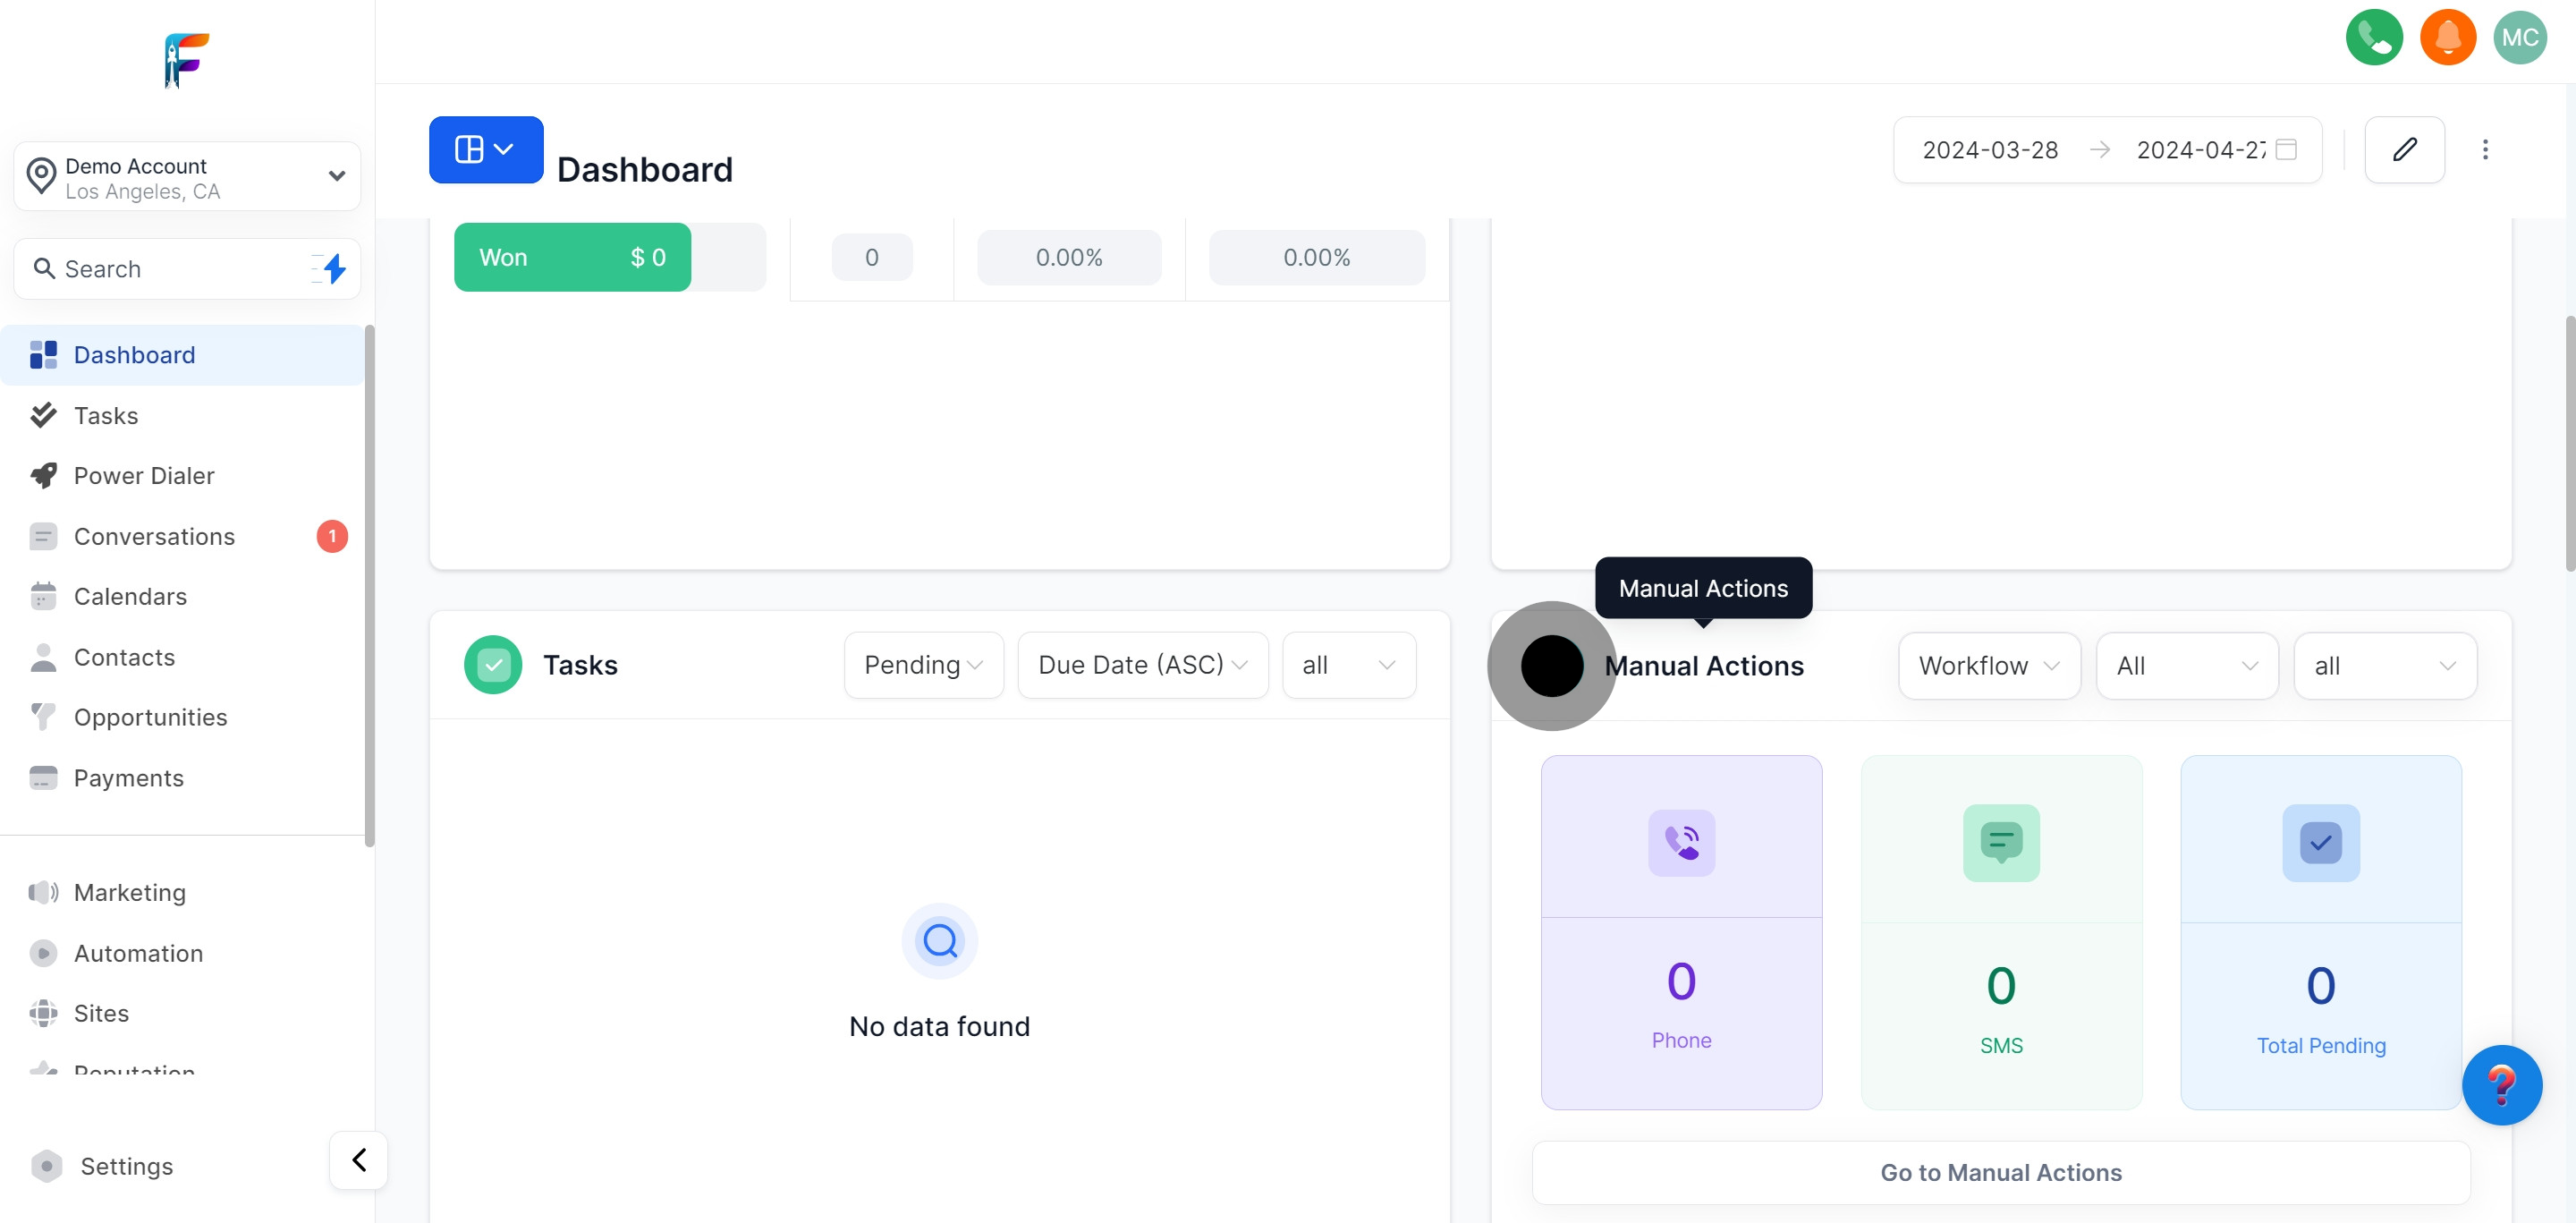
Organize and prioritize your tasks to enhance productivity and follow-up.
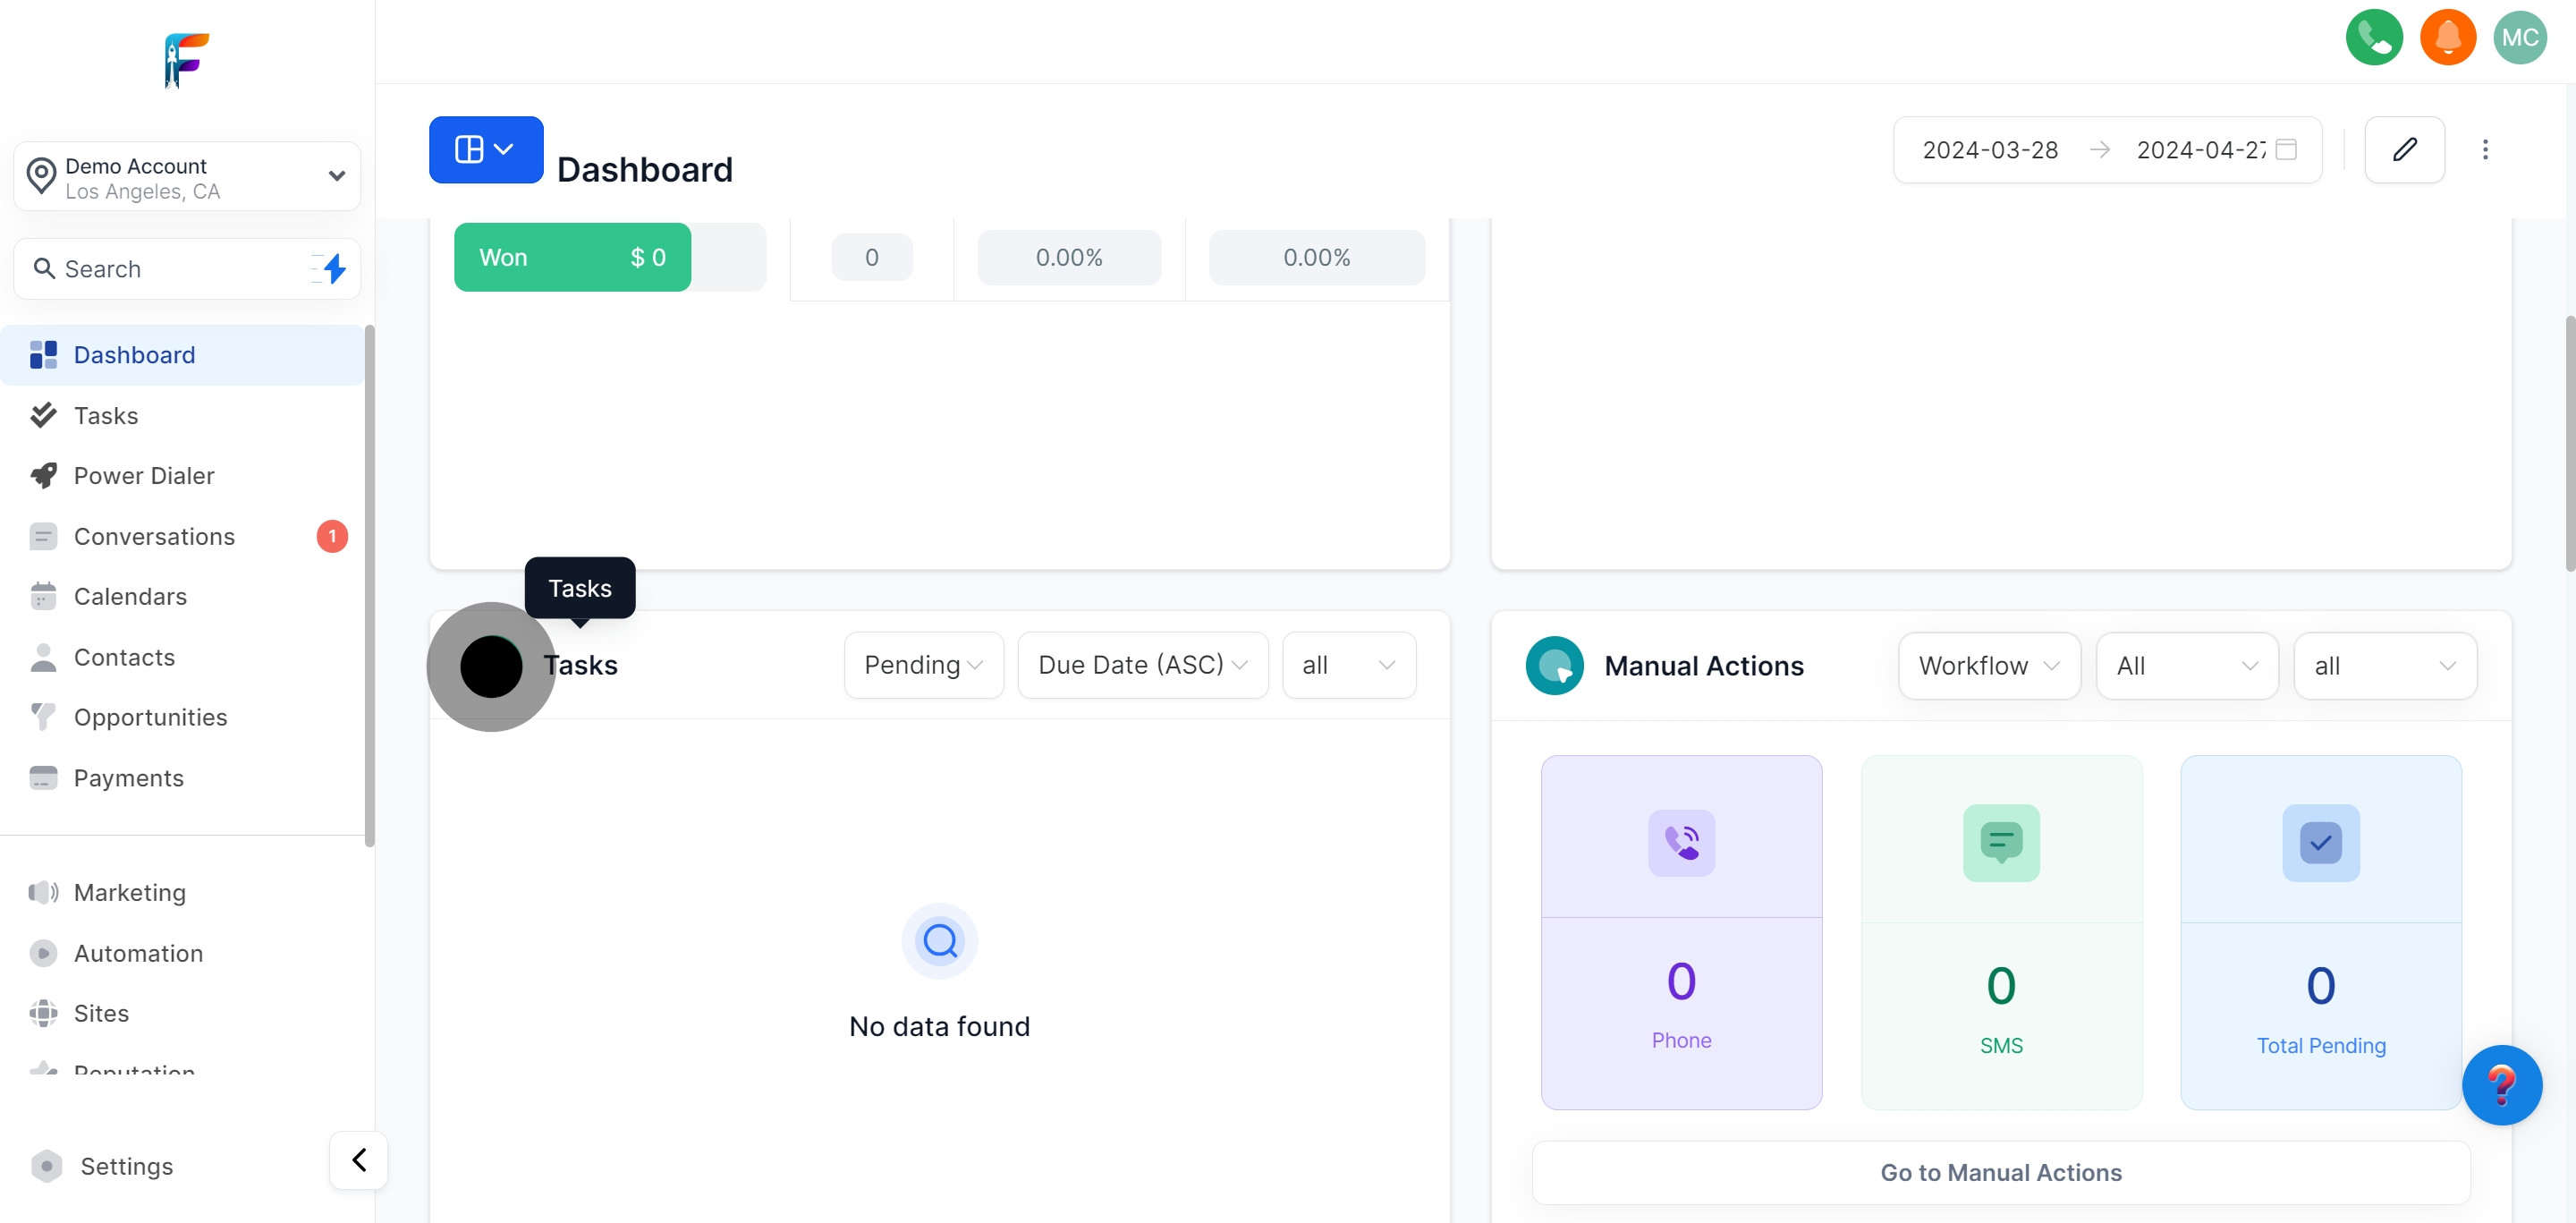
Check and action any manual tasks required for customer engagement.
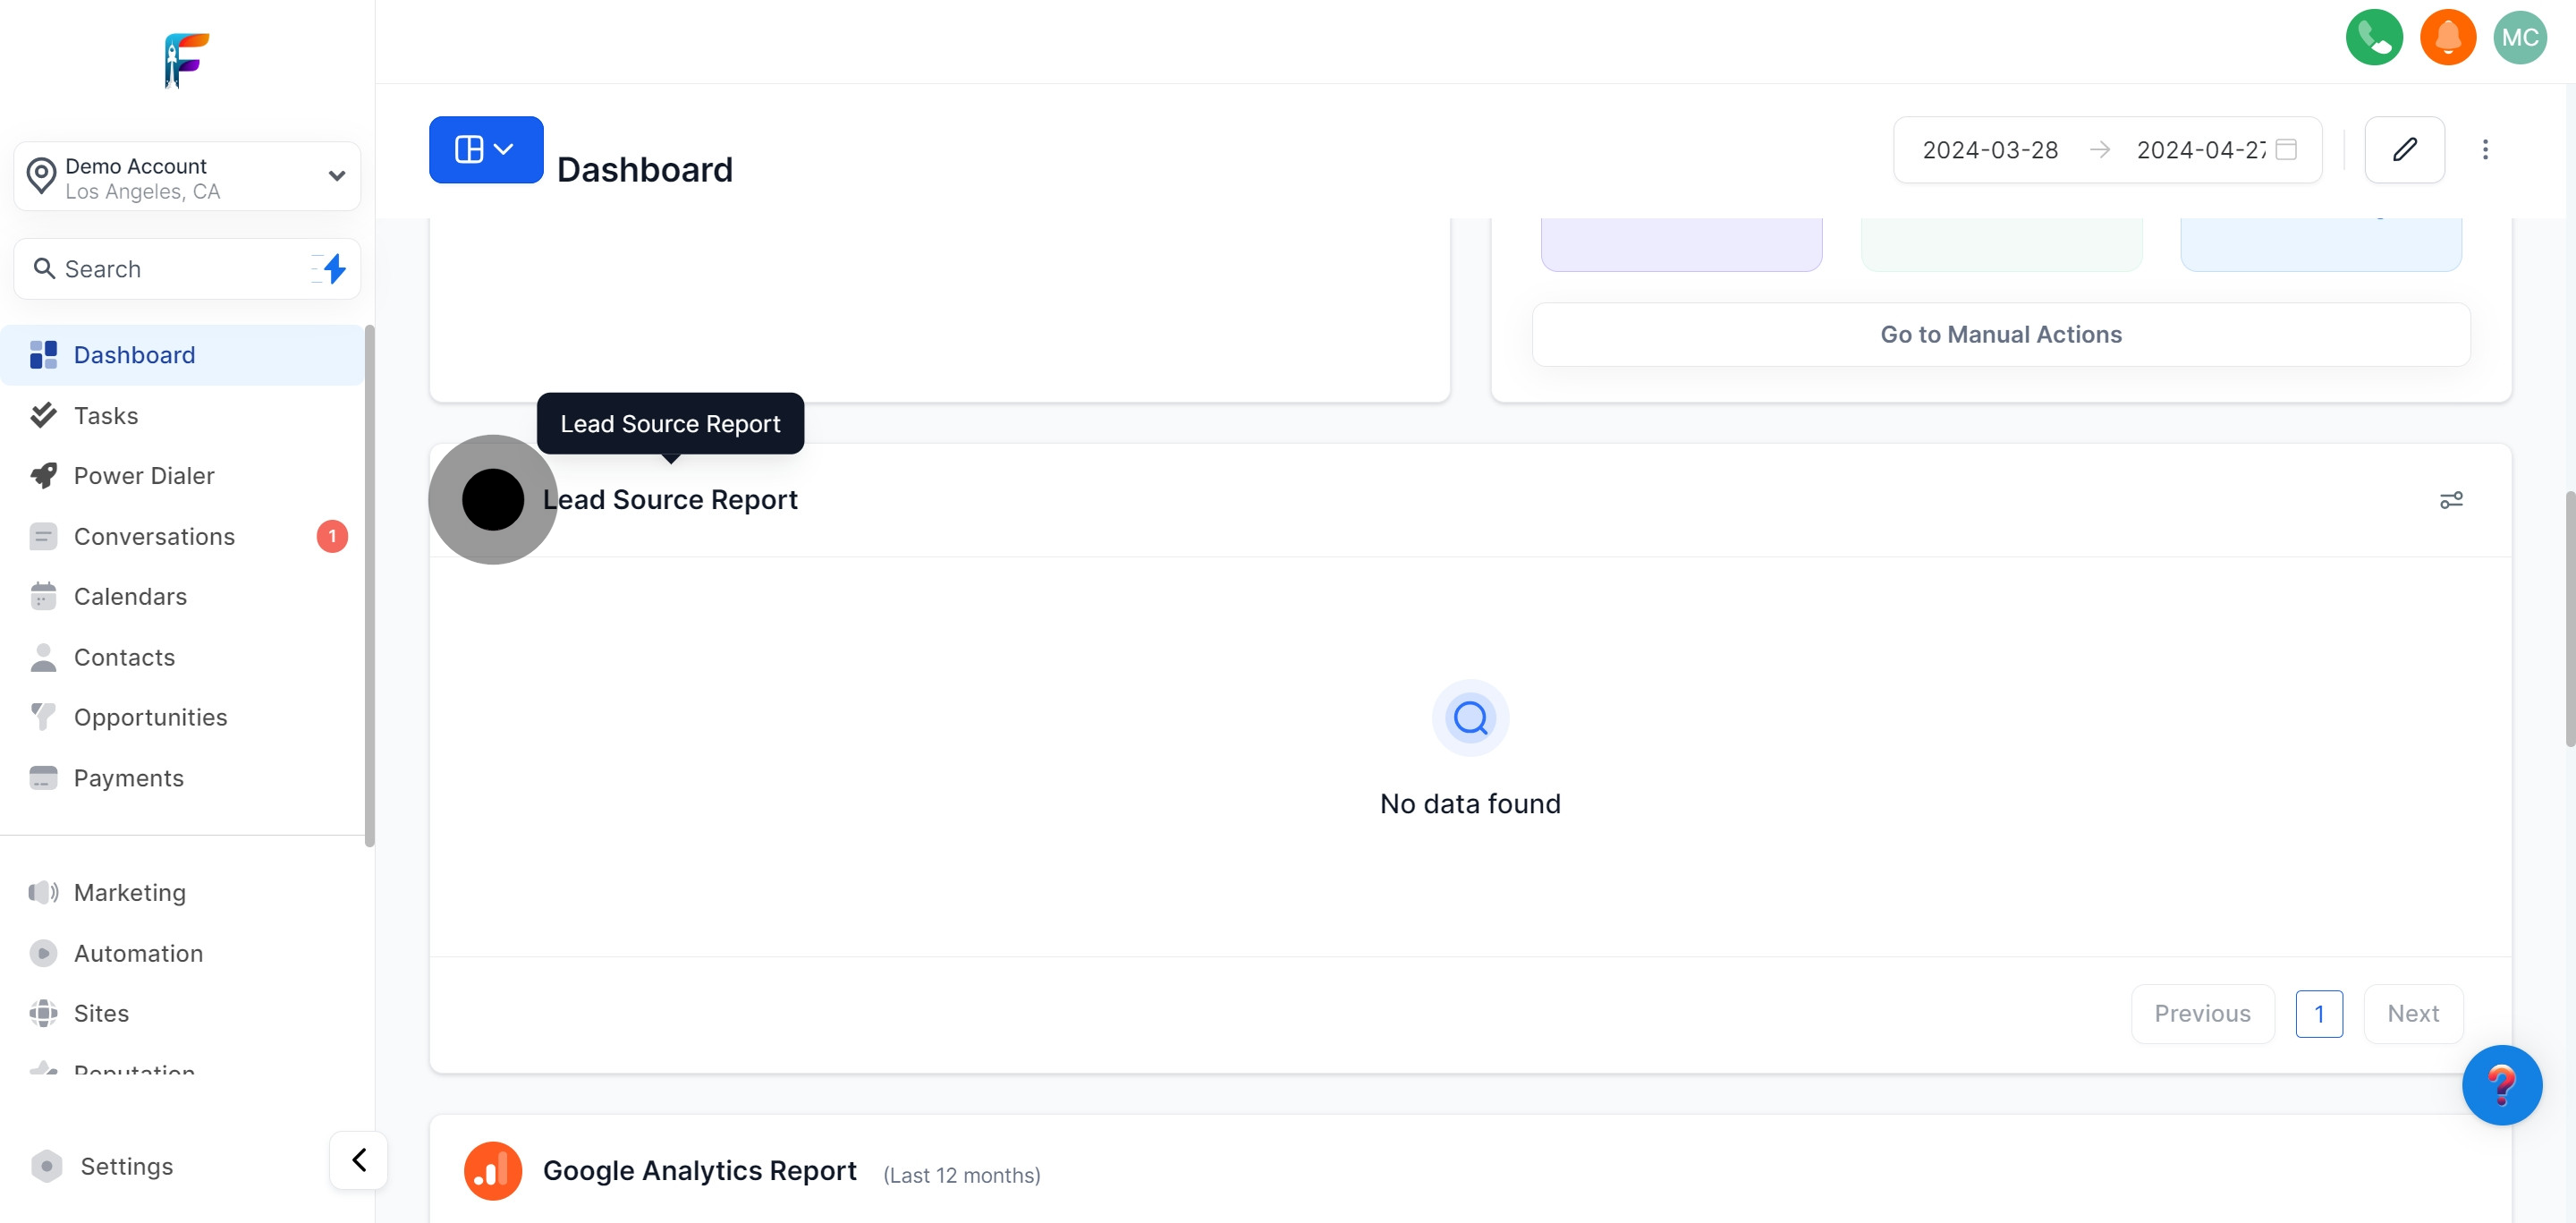
Analyze where your leads are coming from to optimize your marketing strategies.
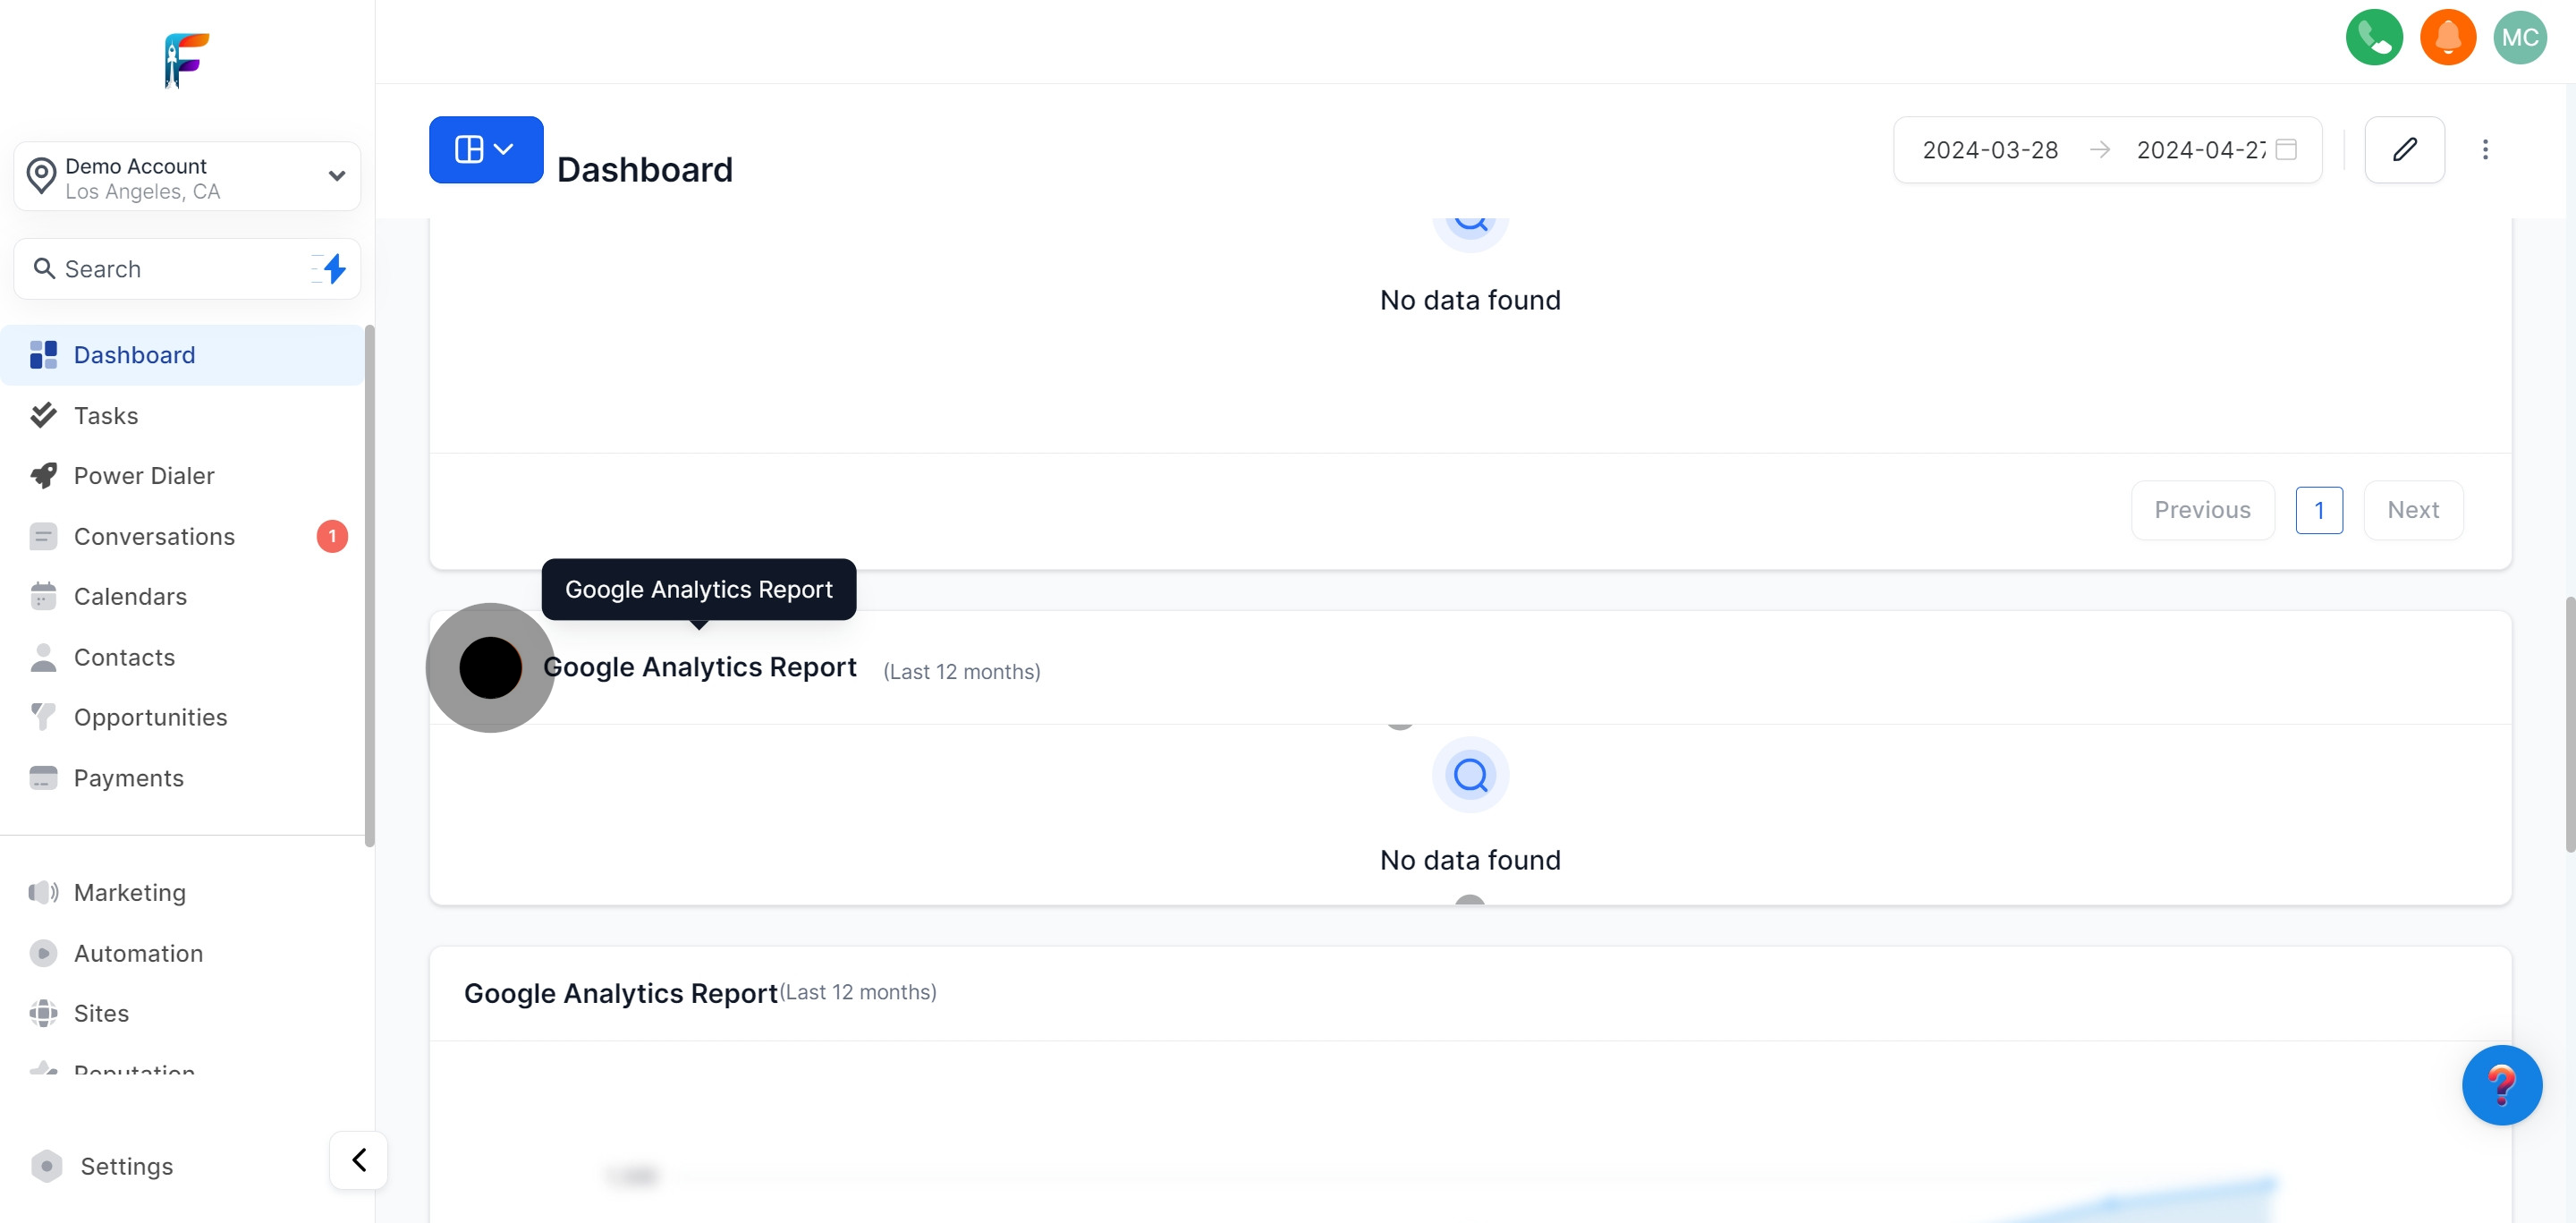
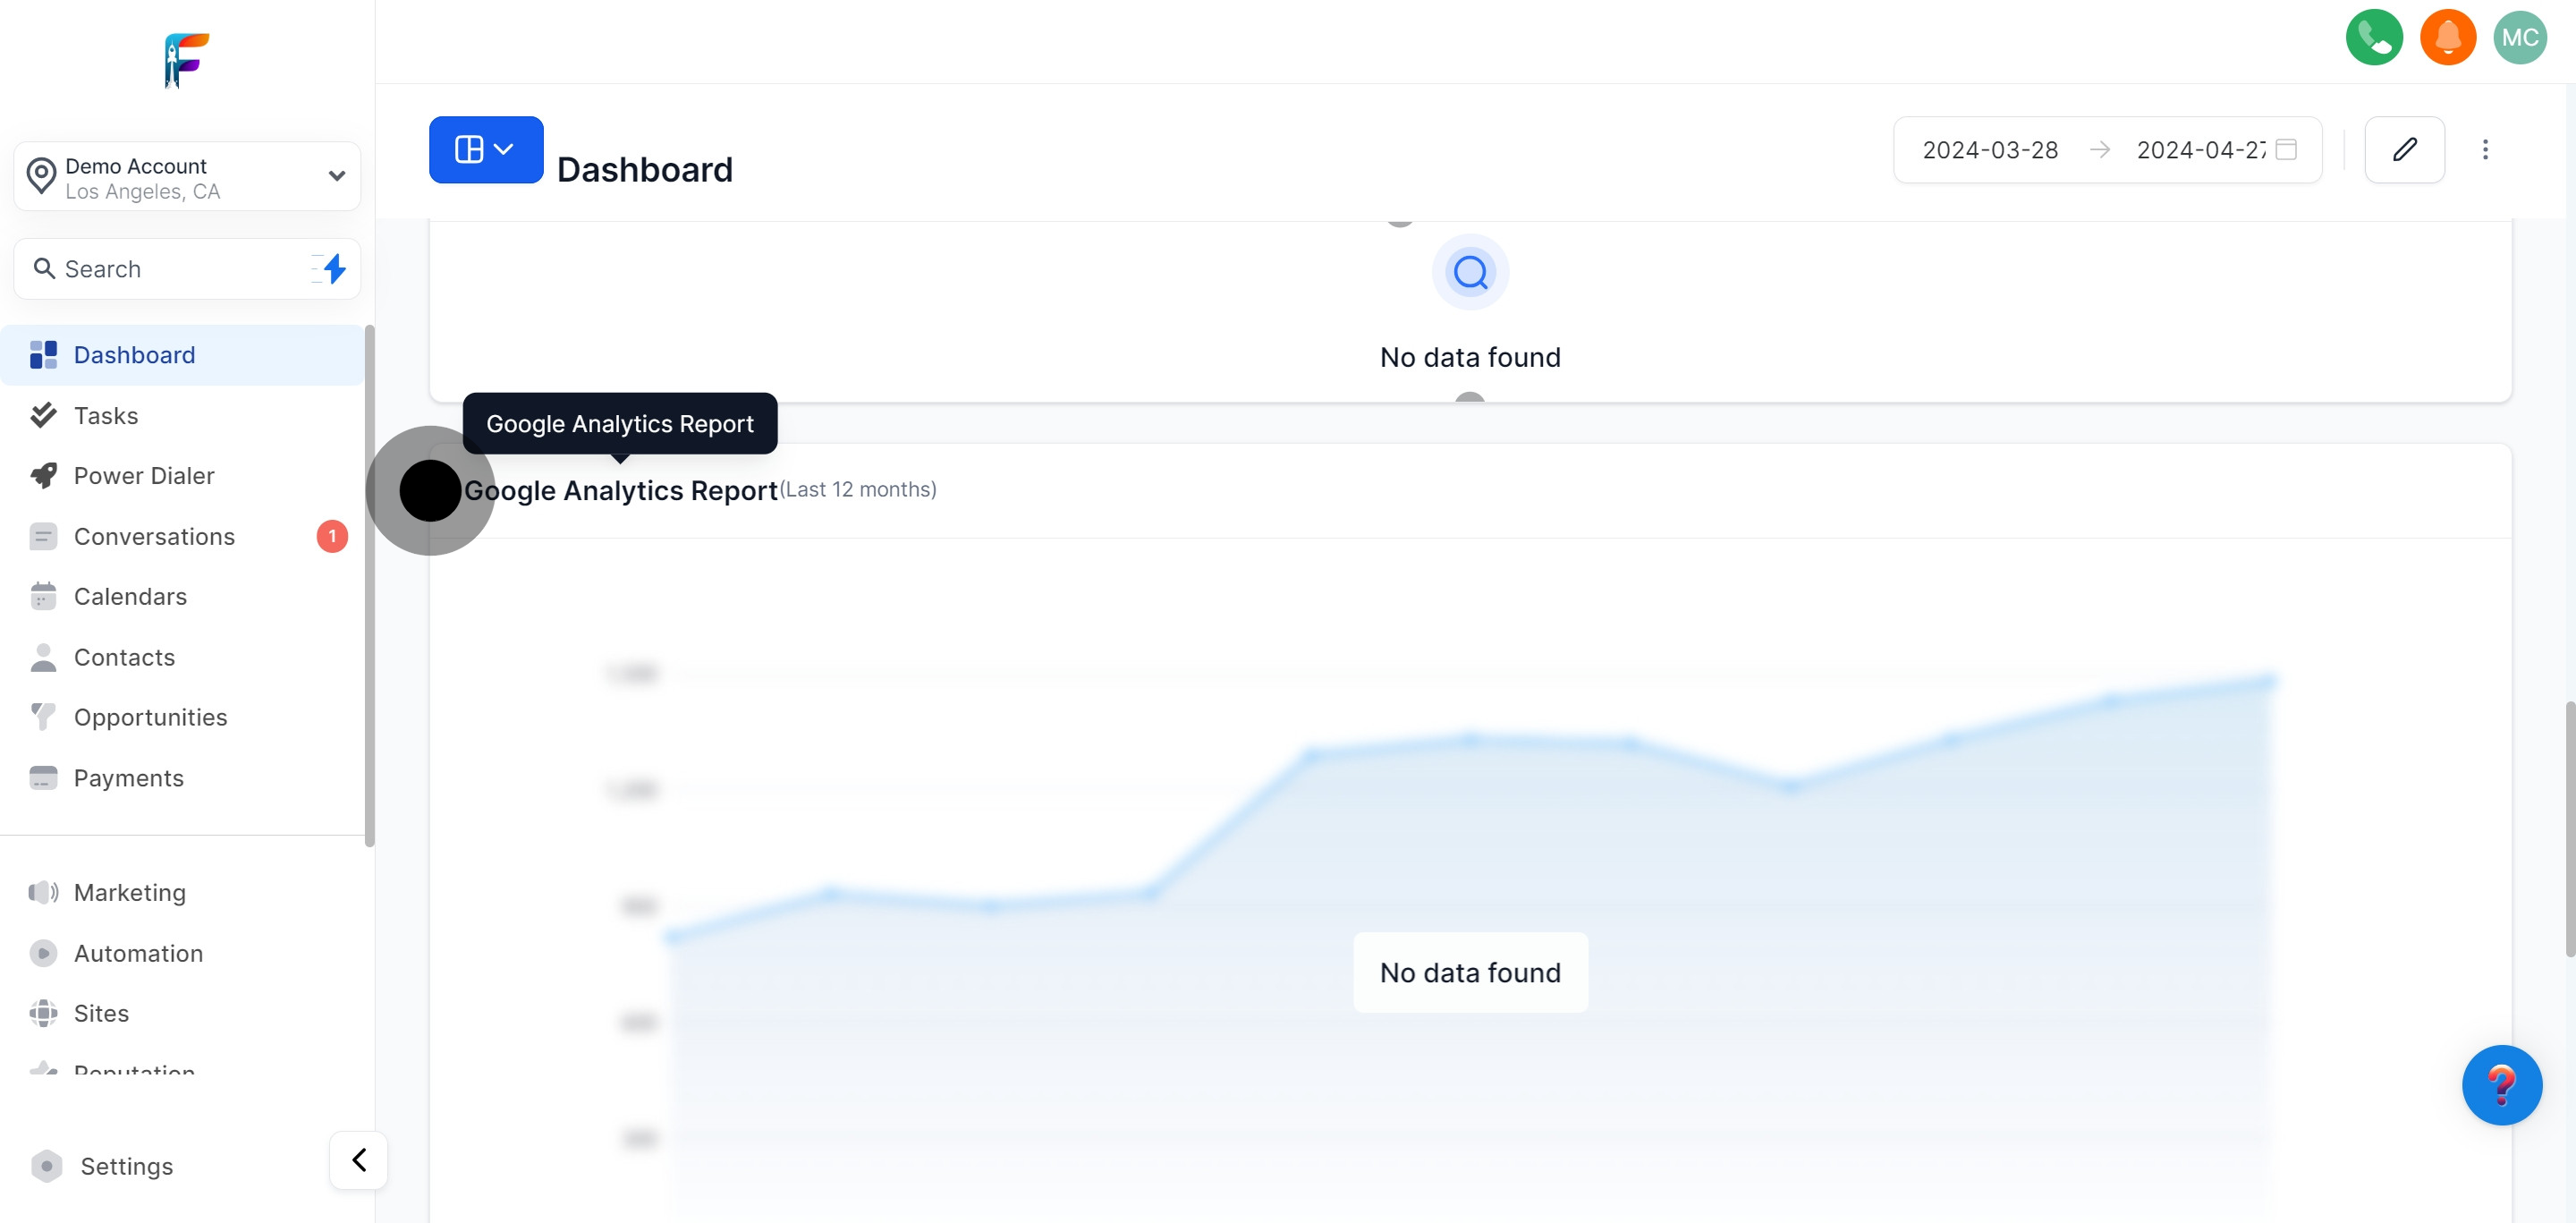
Gain insights from your website traffic and behavior data via Google Analytics.
Delve deeper into specific Google Analytics data with a different report variant.
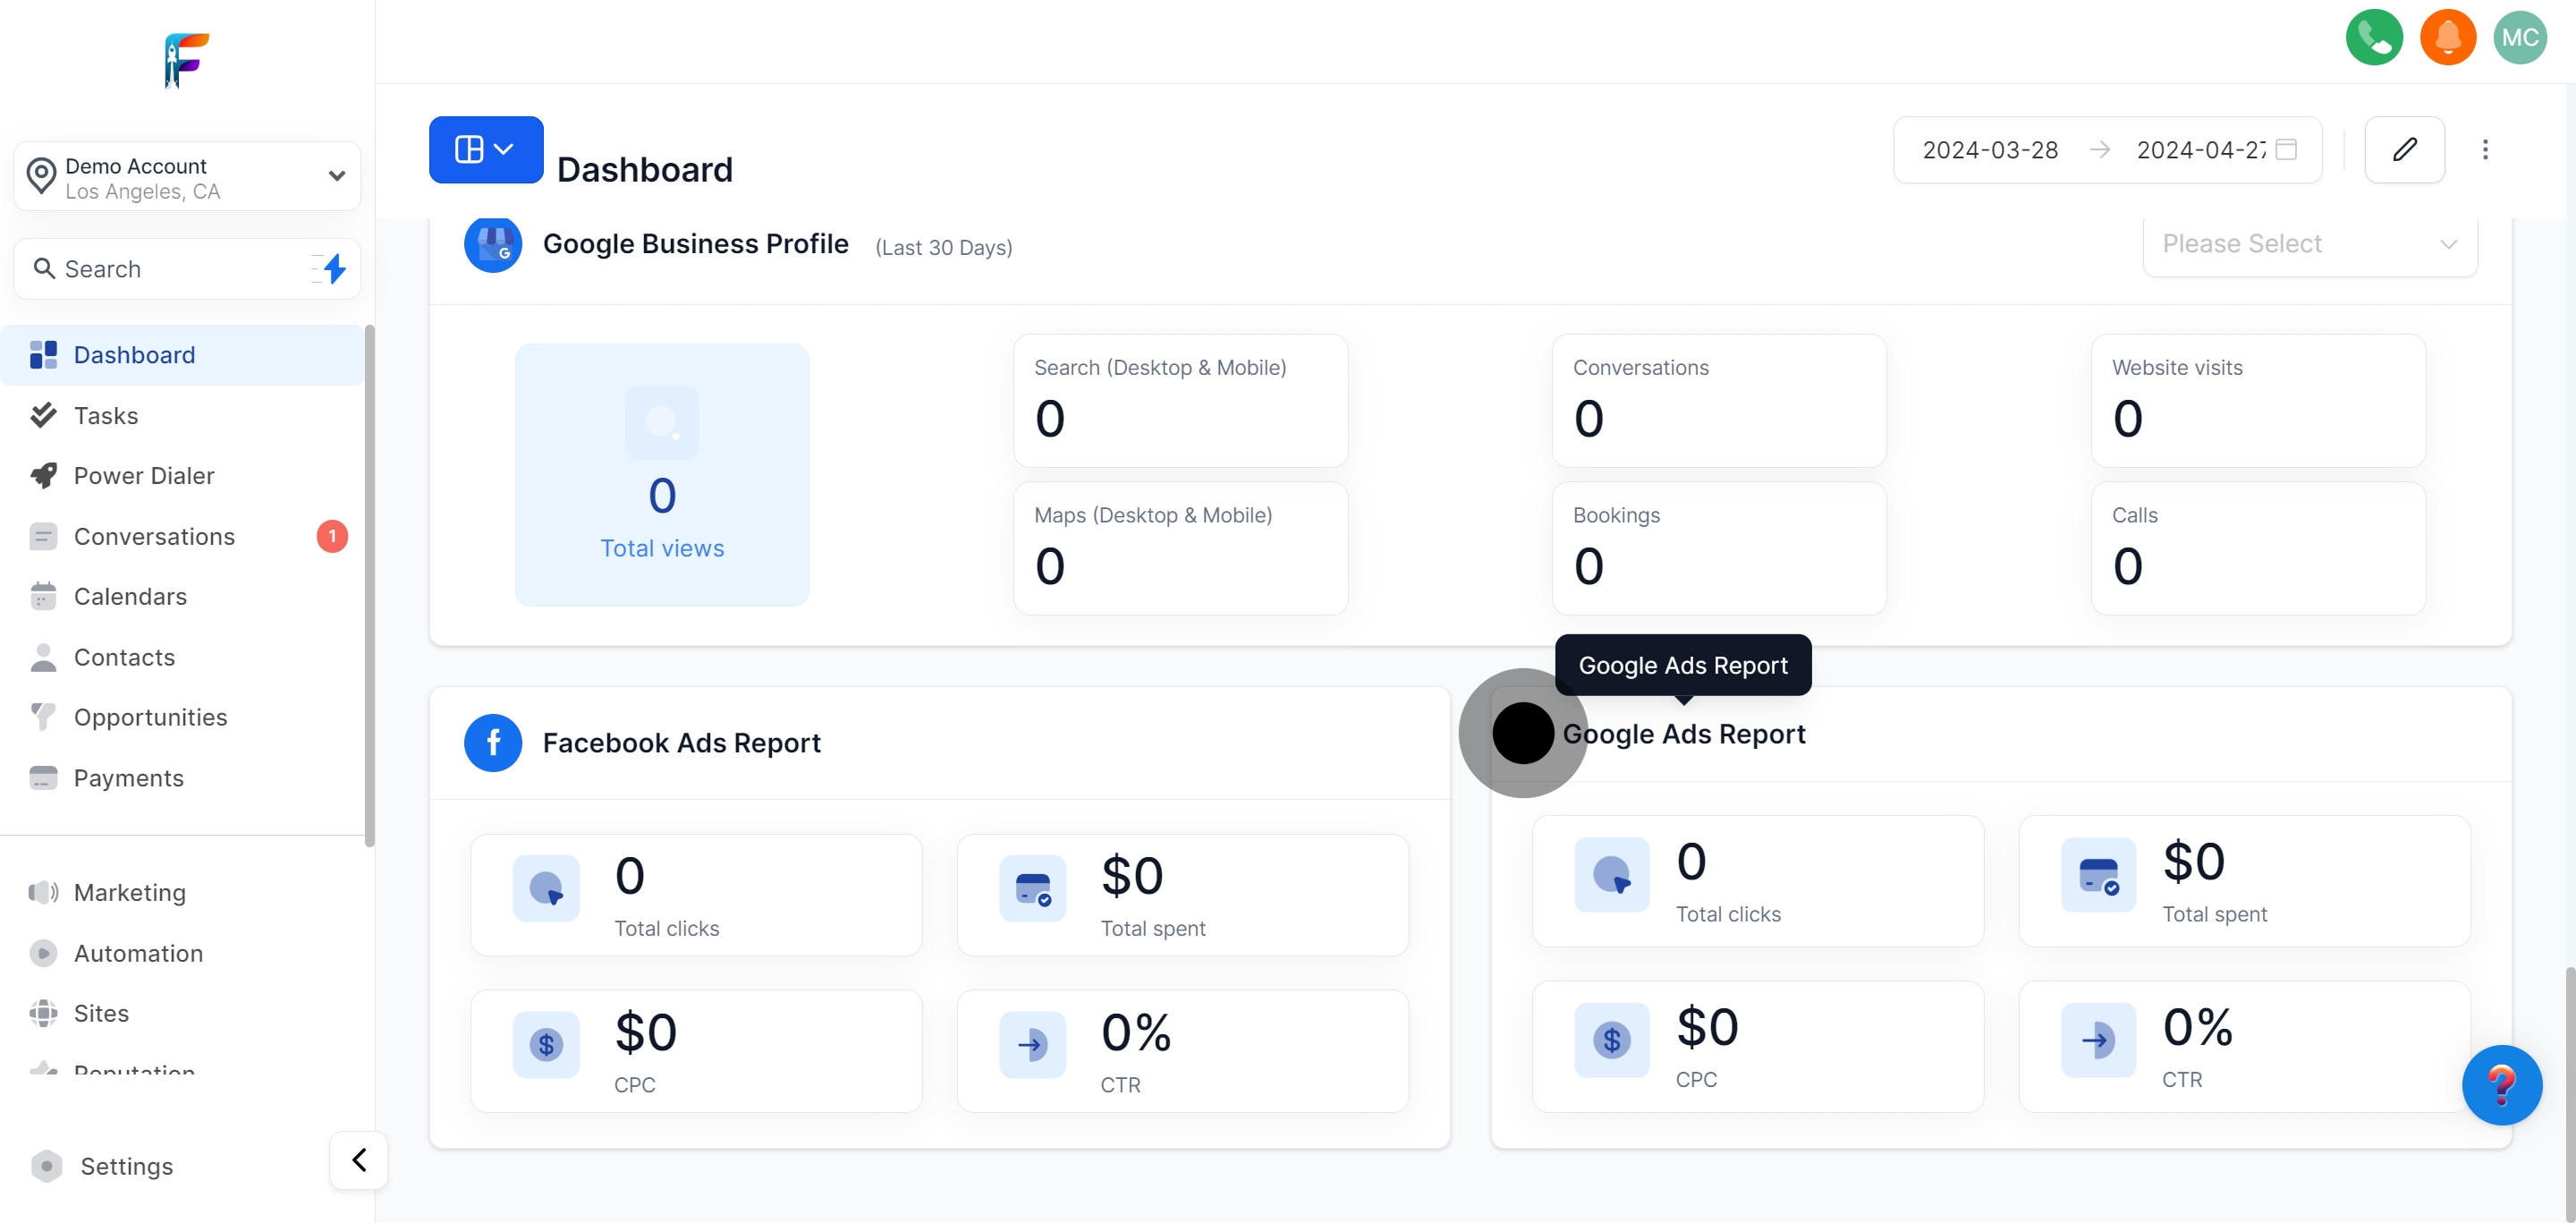
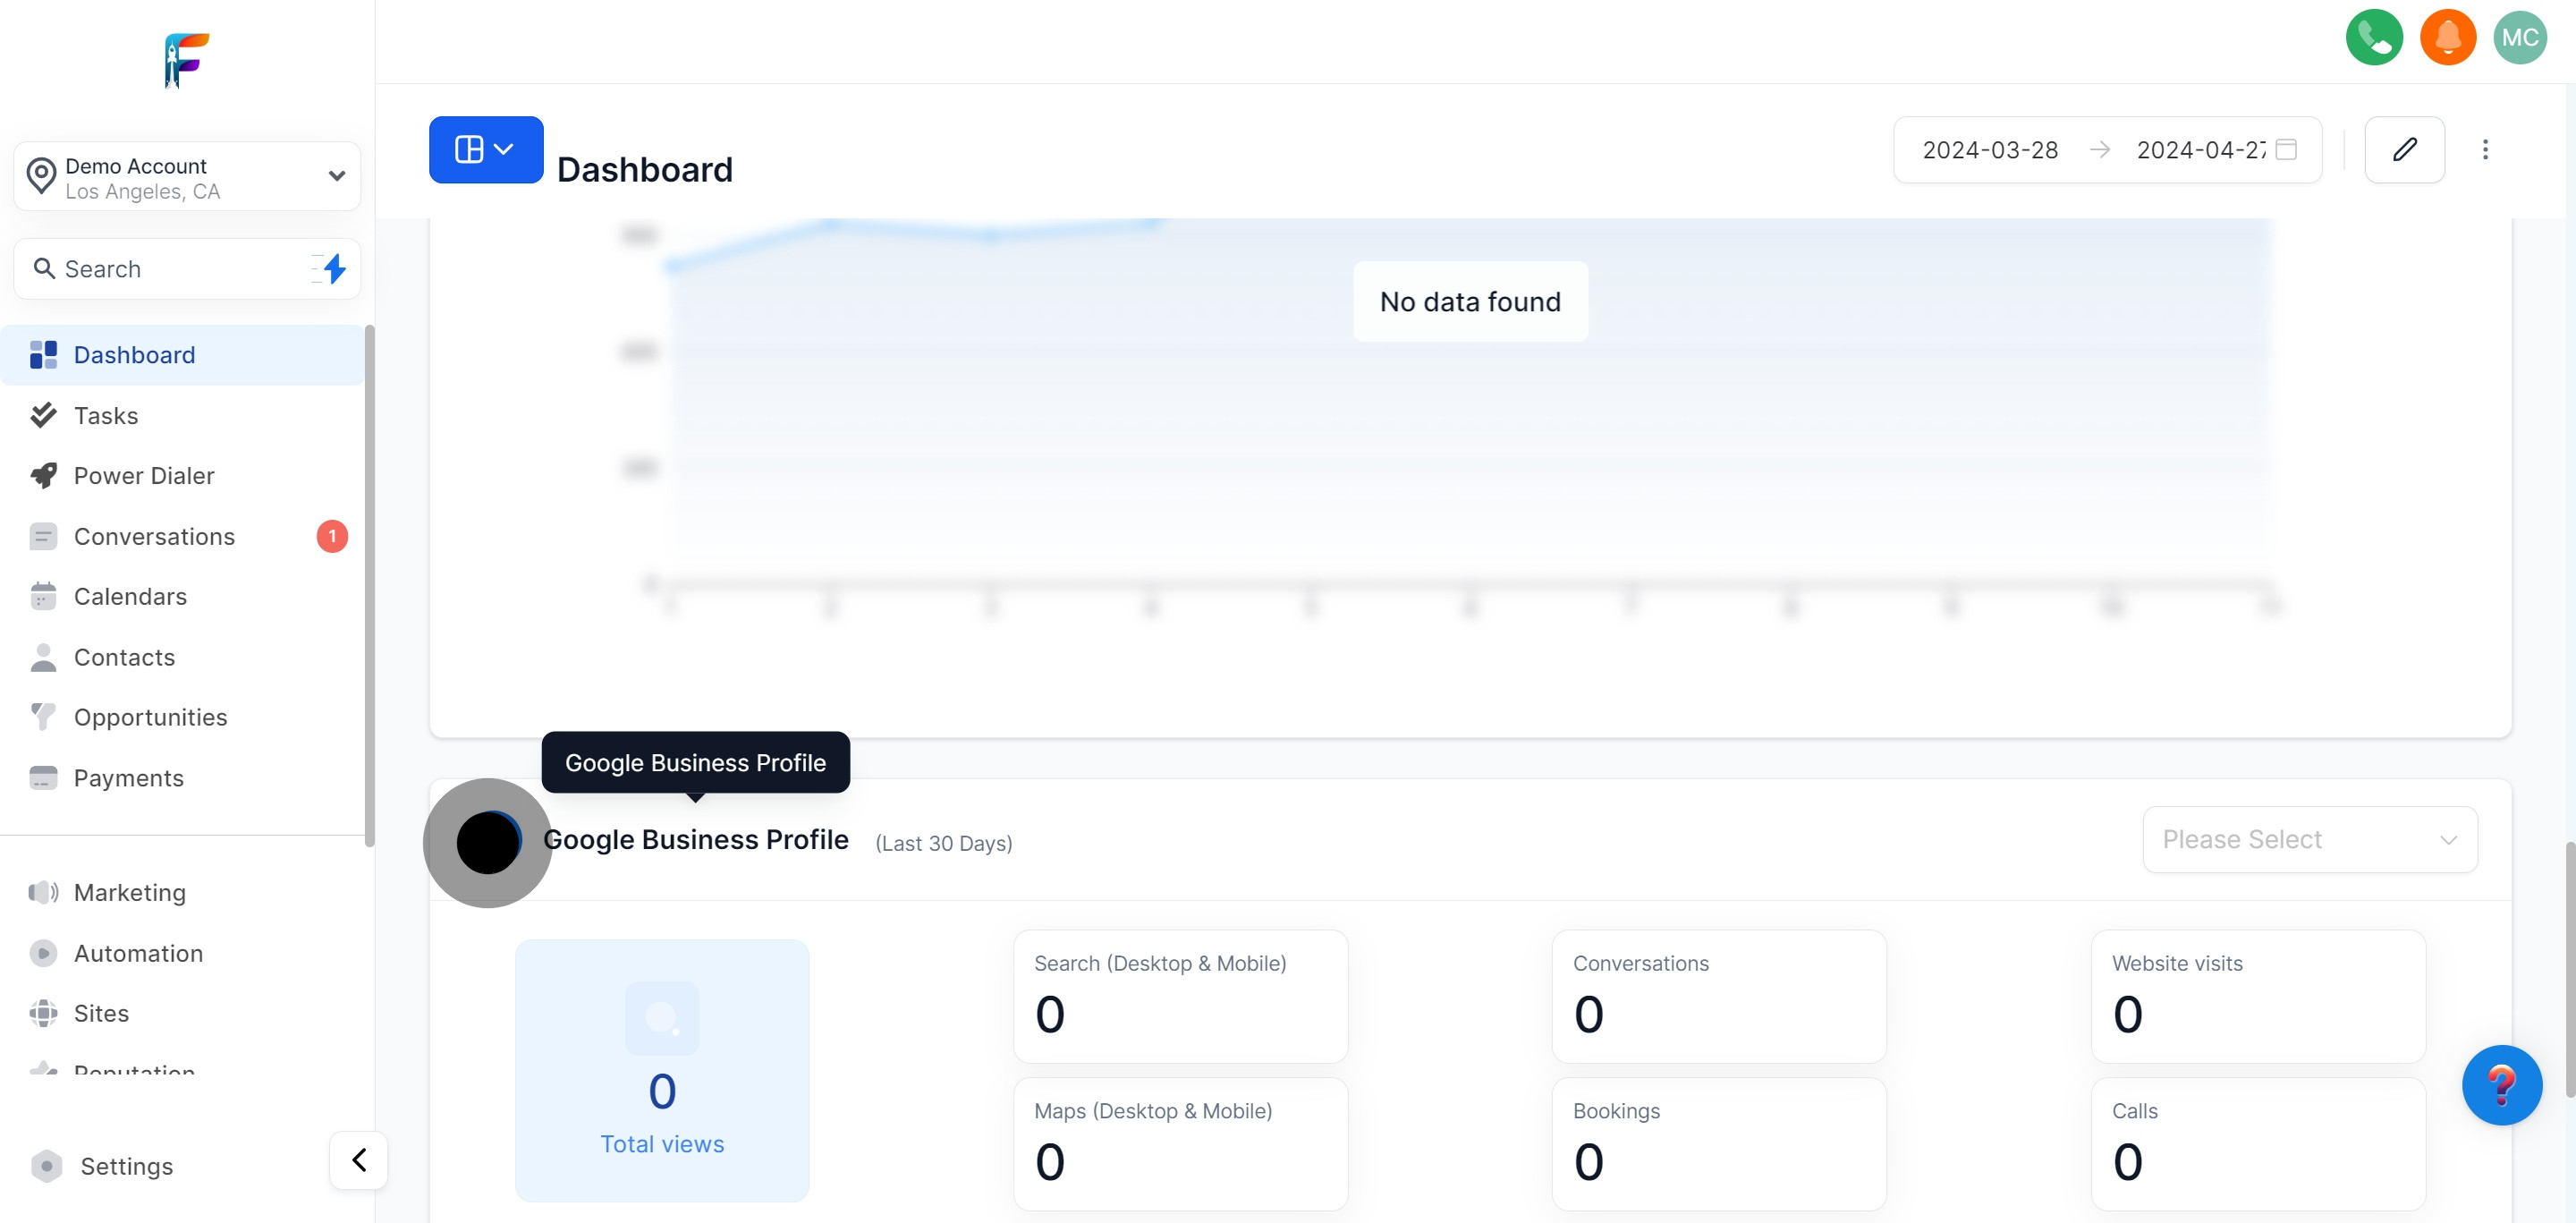
Monitor and manage your presence on Google Business to enhance local SEO.
Analyze the performance of your Facebook advertising campaigns.
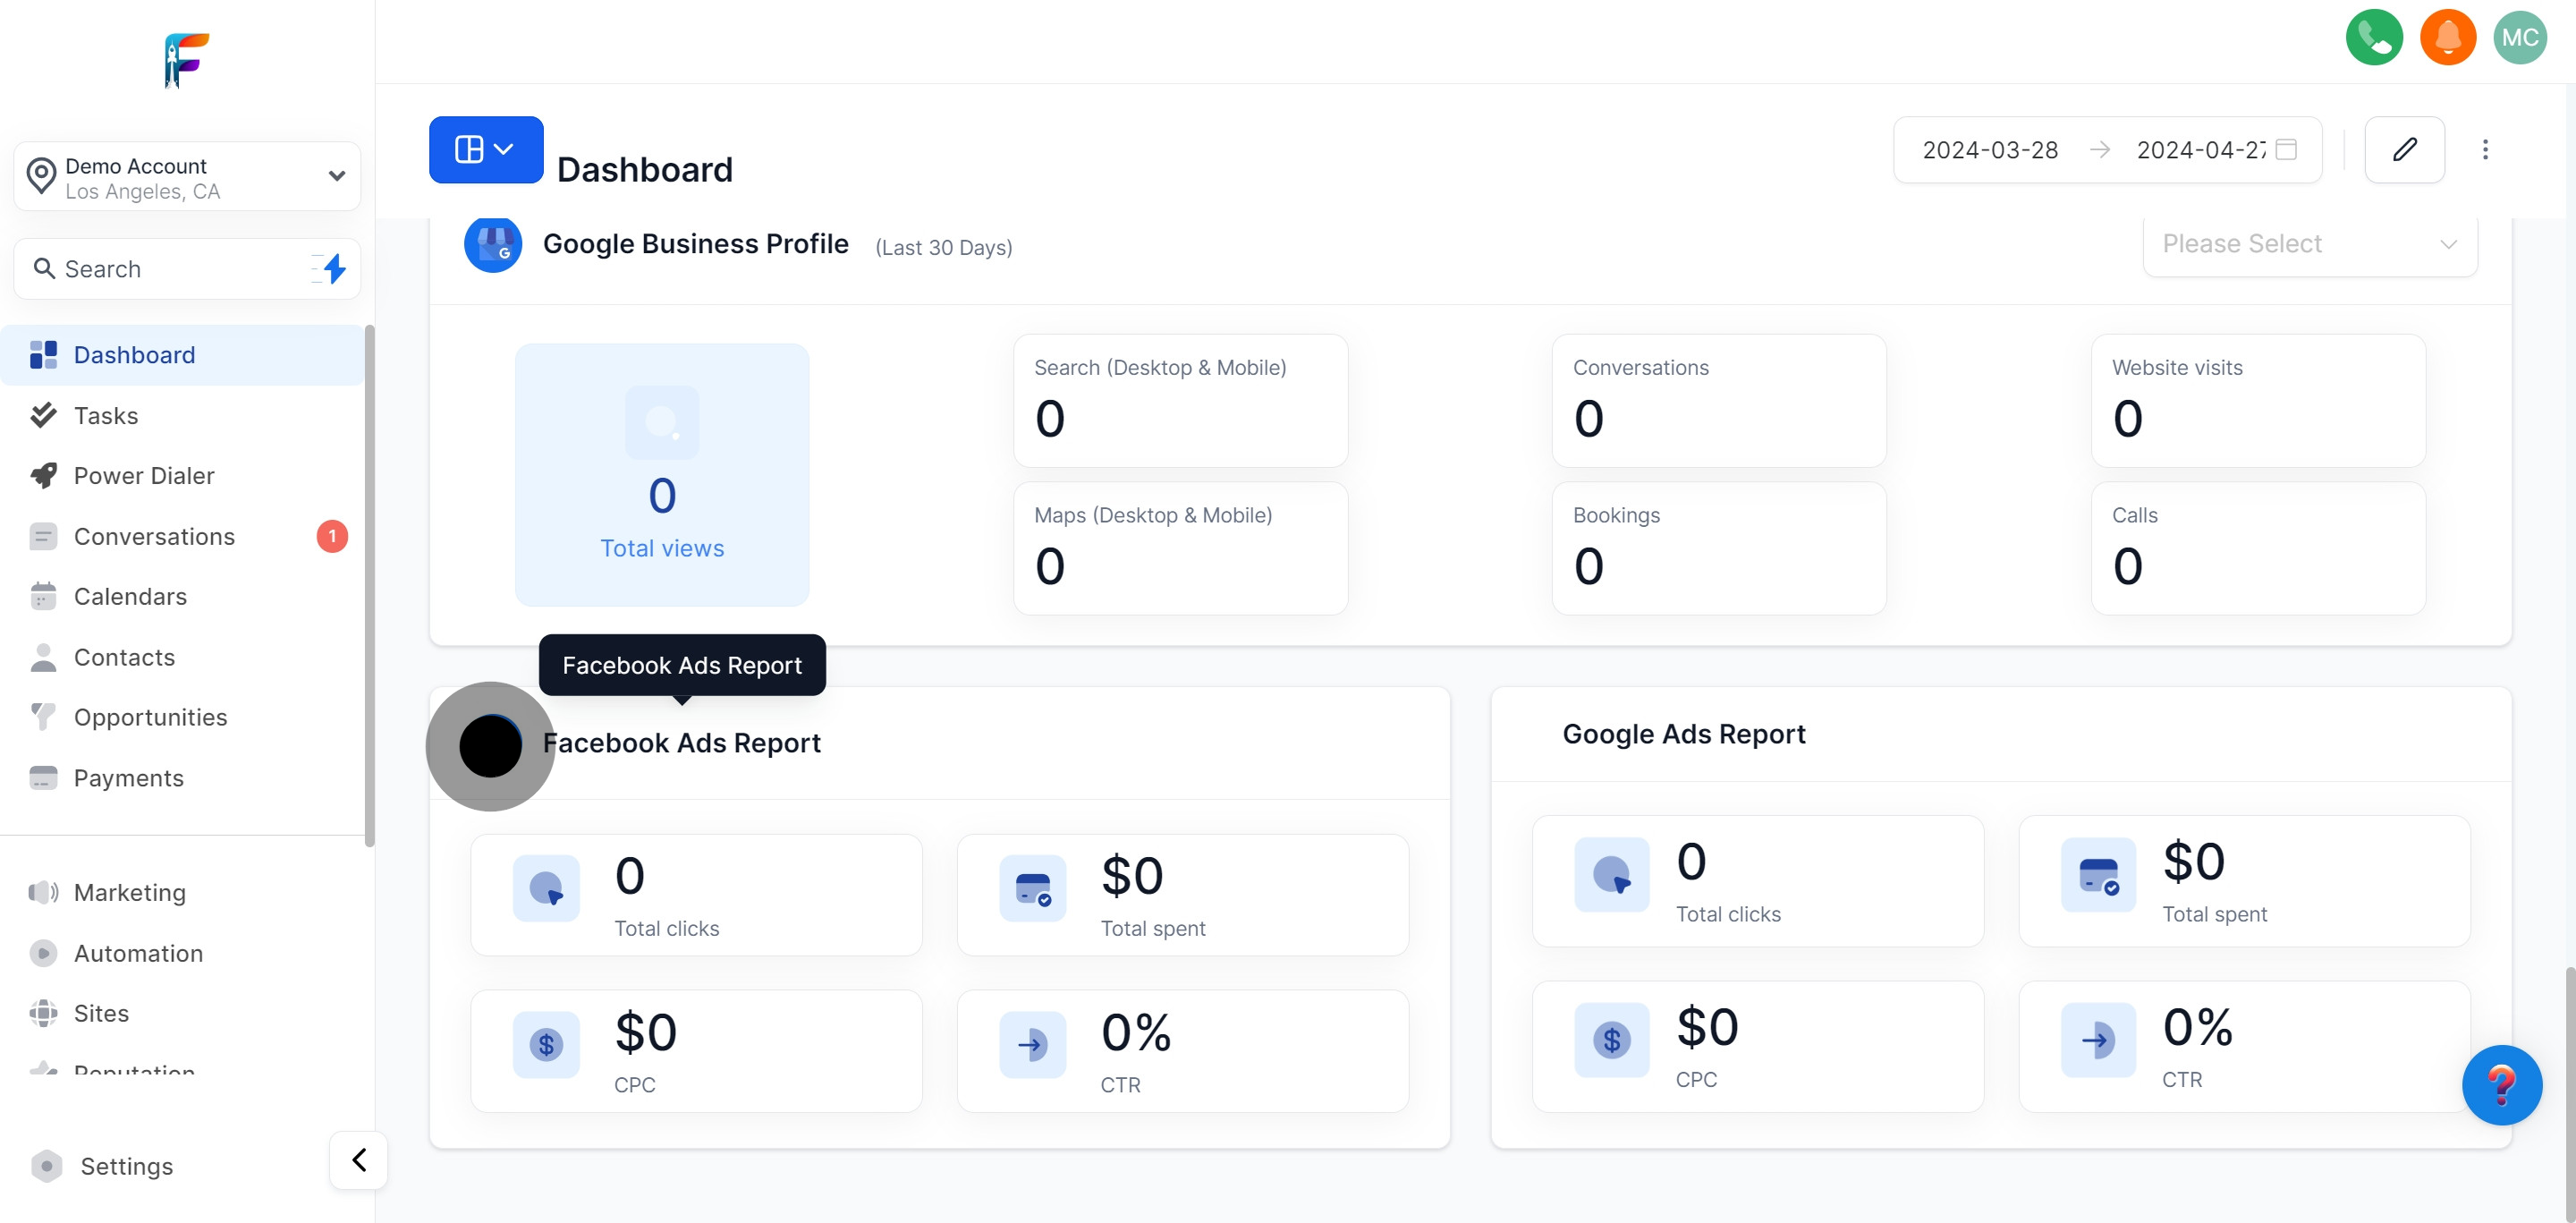
Review and optimize your Google Ads campaigns for better results.